Updated 15 October 2026 · public data, free to reuse
How hard it is to move goods across borders, measured every day.
TradeTurbulence Stress Index0–100
81.4
Severe −0.1 on the day higher than every day of 2010–19
A daily reading of stress in global trade, from 10 public series in five pillars.
Reading for 15 October 2026 · last 180 readings
Open the index →Route displacement
11.6%
of chokepoint traffic is on a different route than in 2019–23 (baseline 3.8%).
IMF PortWatch · 11 Oct
All 28 chokepoints →Most disrupted route
−100%
Kerch Strait: 0 transits a day against a 2019–23 baseline of 38.
30-day mean · 11 Oct
Route detail →Brent crude in rupees
₹12,042.10
Very high99th percentile of five years
INR per barrel · 14 Oct
All indicators →Where trade is being diverted
All 28 routes →Latest analysis
All 40 pieces →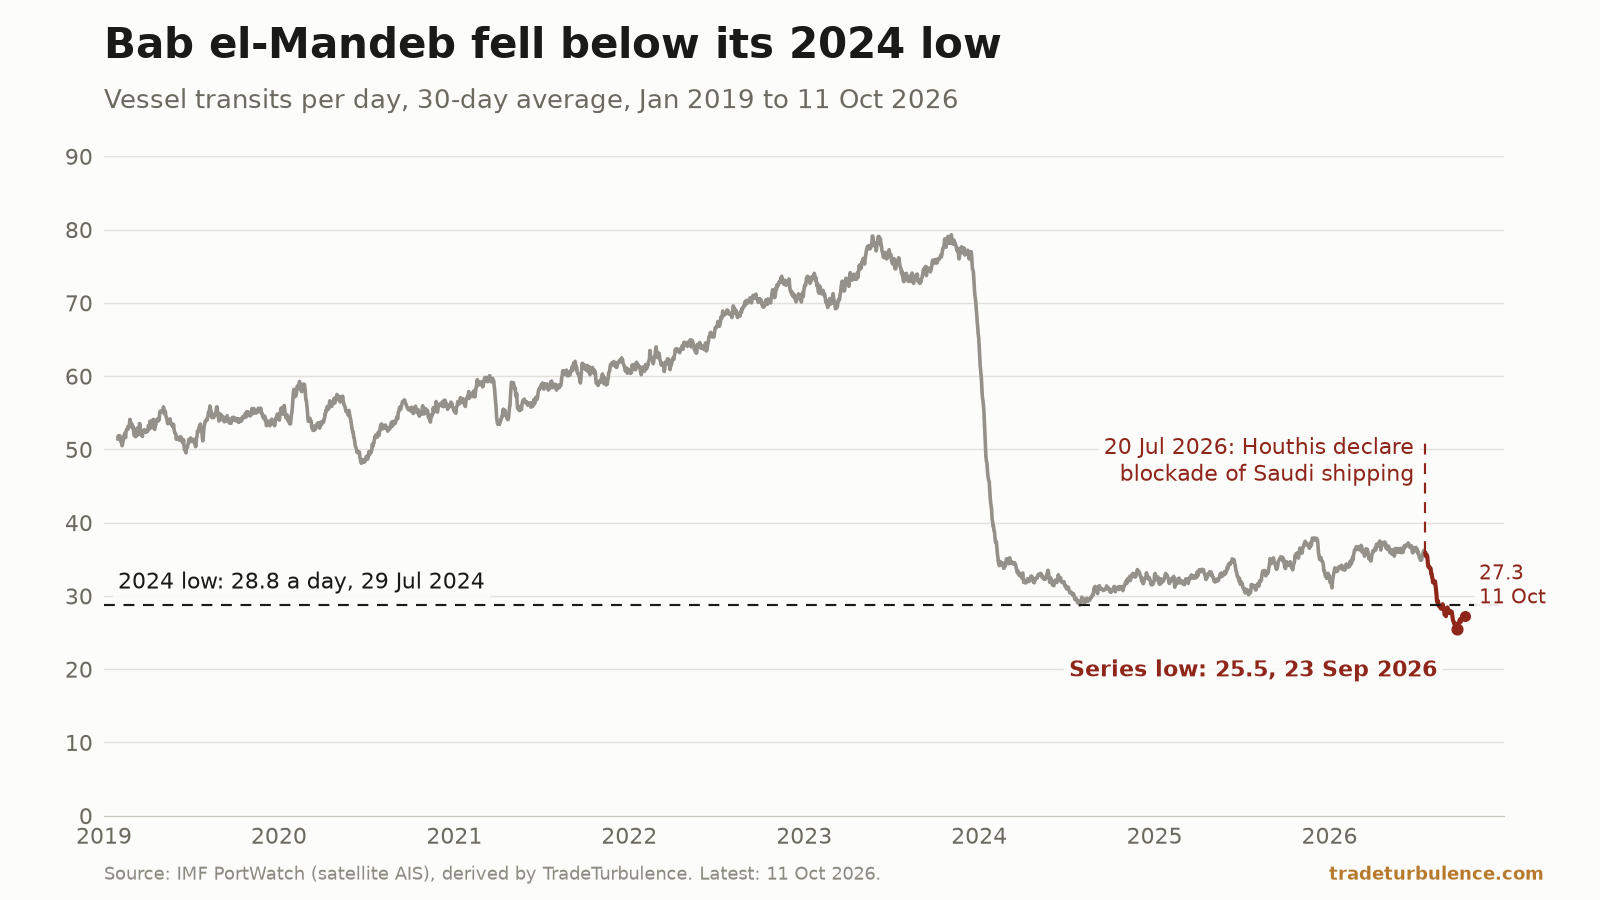
Geopolitics & trade16 Oct 2026
Bab el-Mandeb fell below its 2024 low. Suez did not.
Bab el-Mandeb's 30-day traffic hit 25.5 transits a day on 23 September, the lowest in PortWatch's series from 2019. Tankers were 61% of the fall. Suez held.
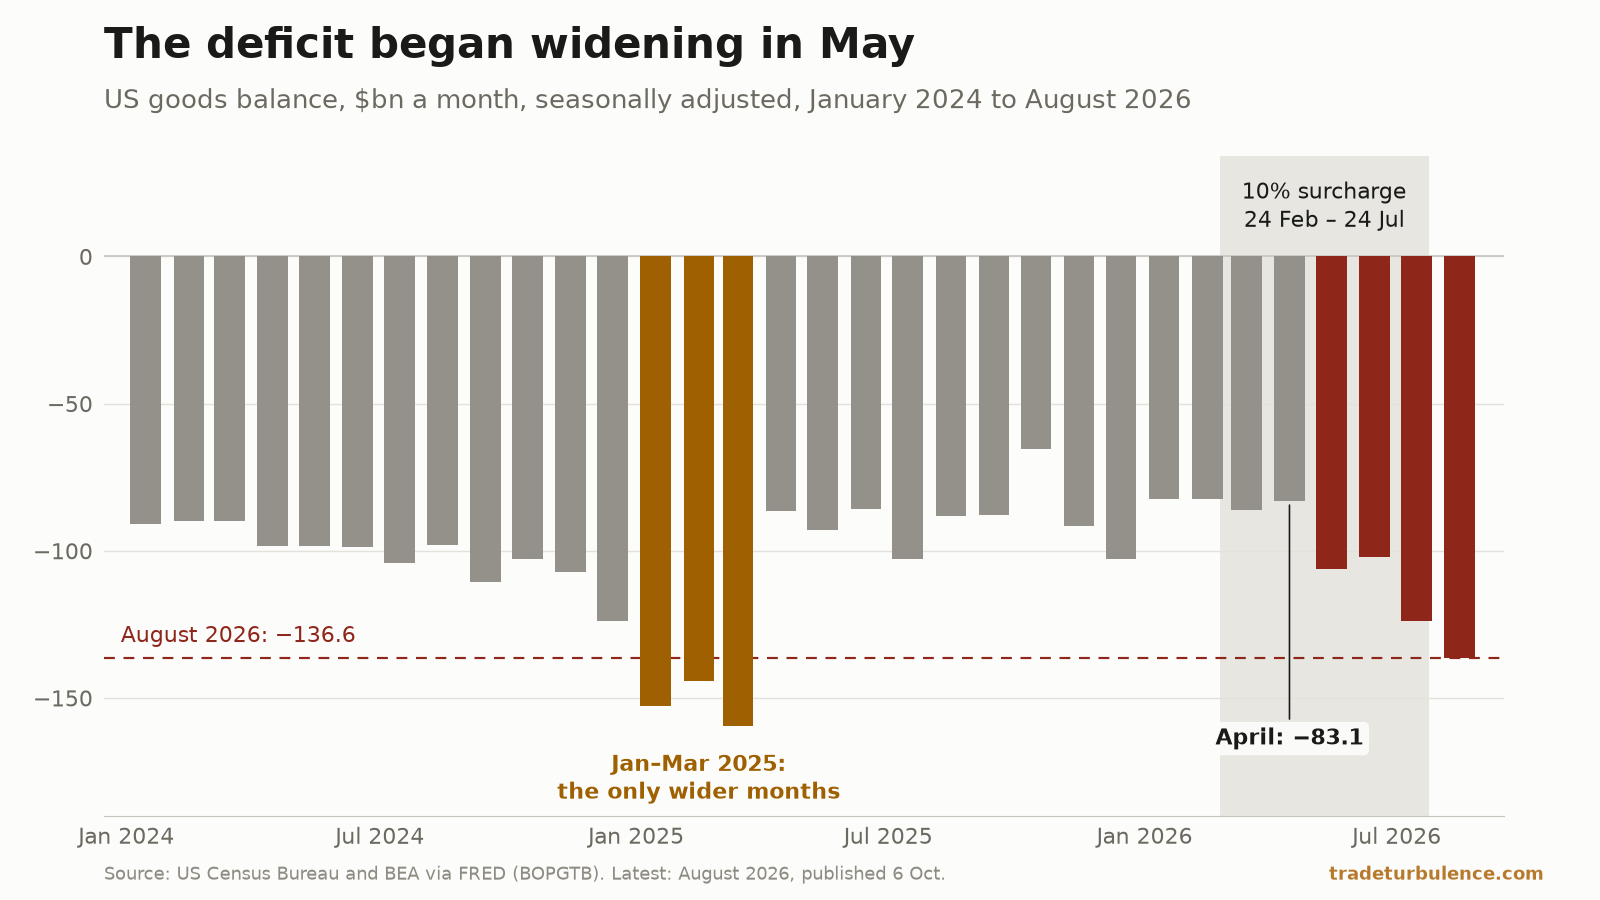
Read · 9 min →- The surcharge ended in July. The deficit began widening in May.
The US goods deficit reached $136.6bn in August, its widest since March 2025. Of the $53.5bn widening since April, $40.7bn was in the data by July.
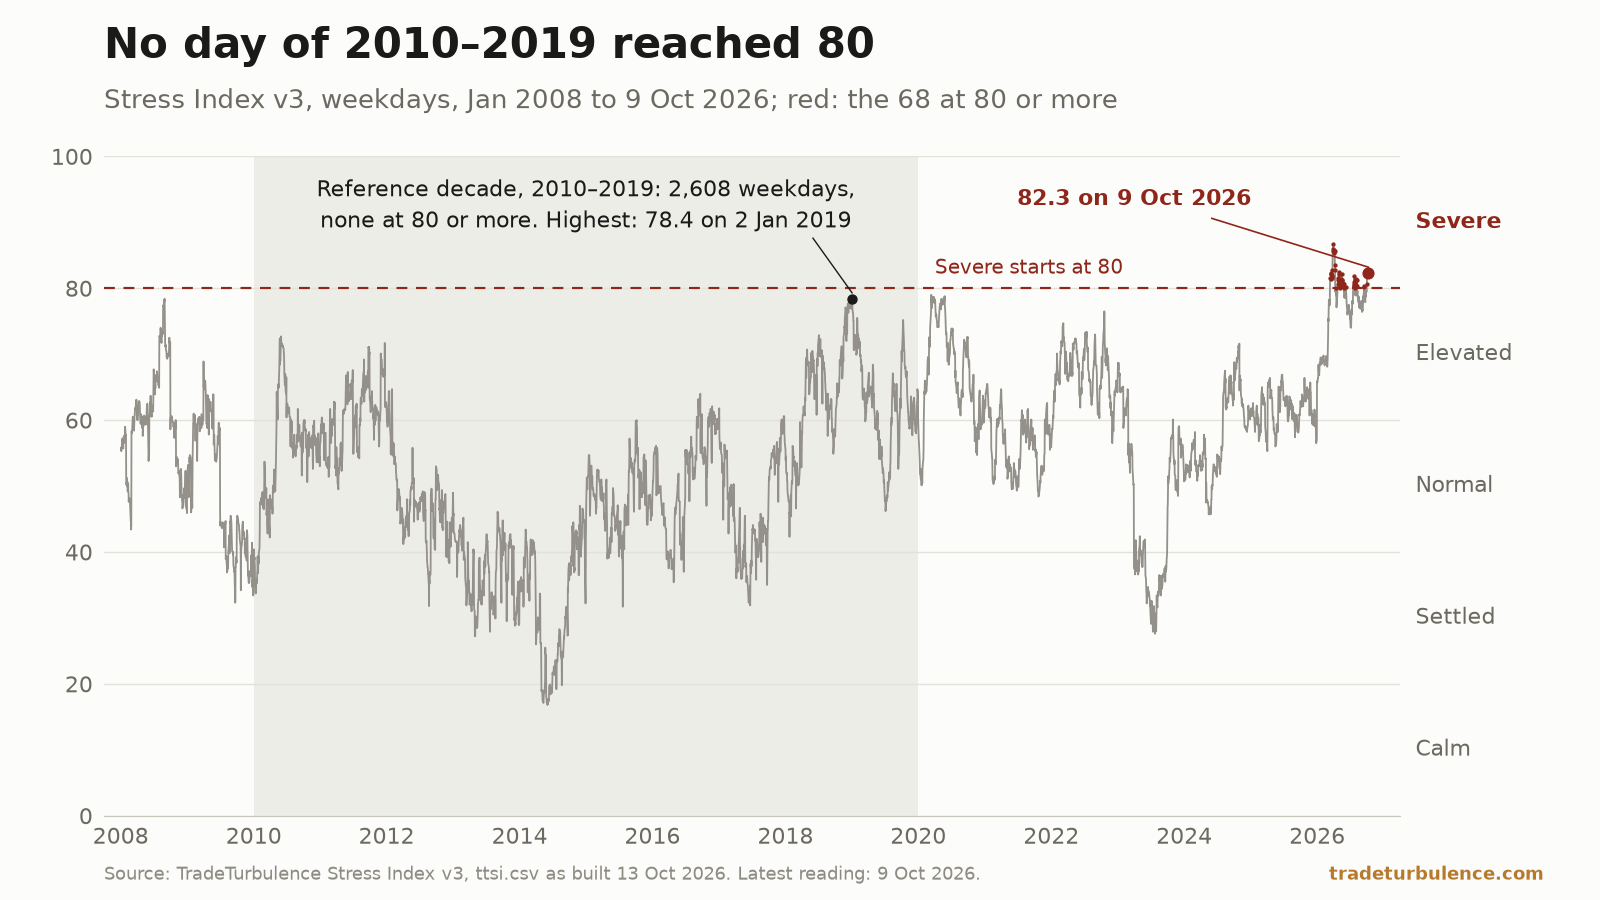
- A Stress Index of 80 is higher than any day of 2010–2019
Severe starts at 80. No weekday of 2010–2019 reached it. As built at 02:16 UTC on 13 October 2026, 68 weekdays of 2026 had; version 3 read 82.3 for 9 October.
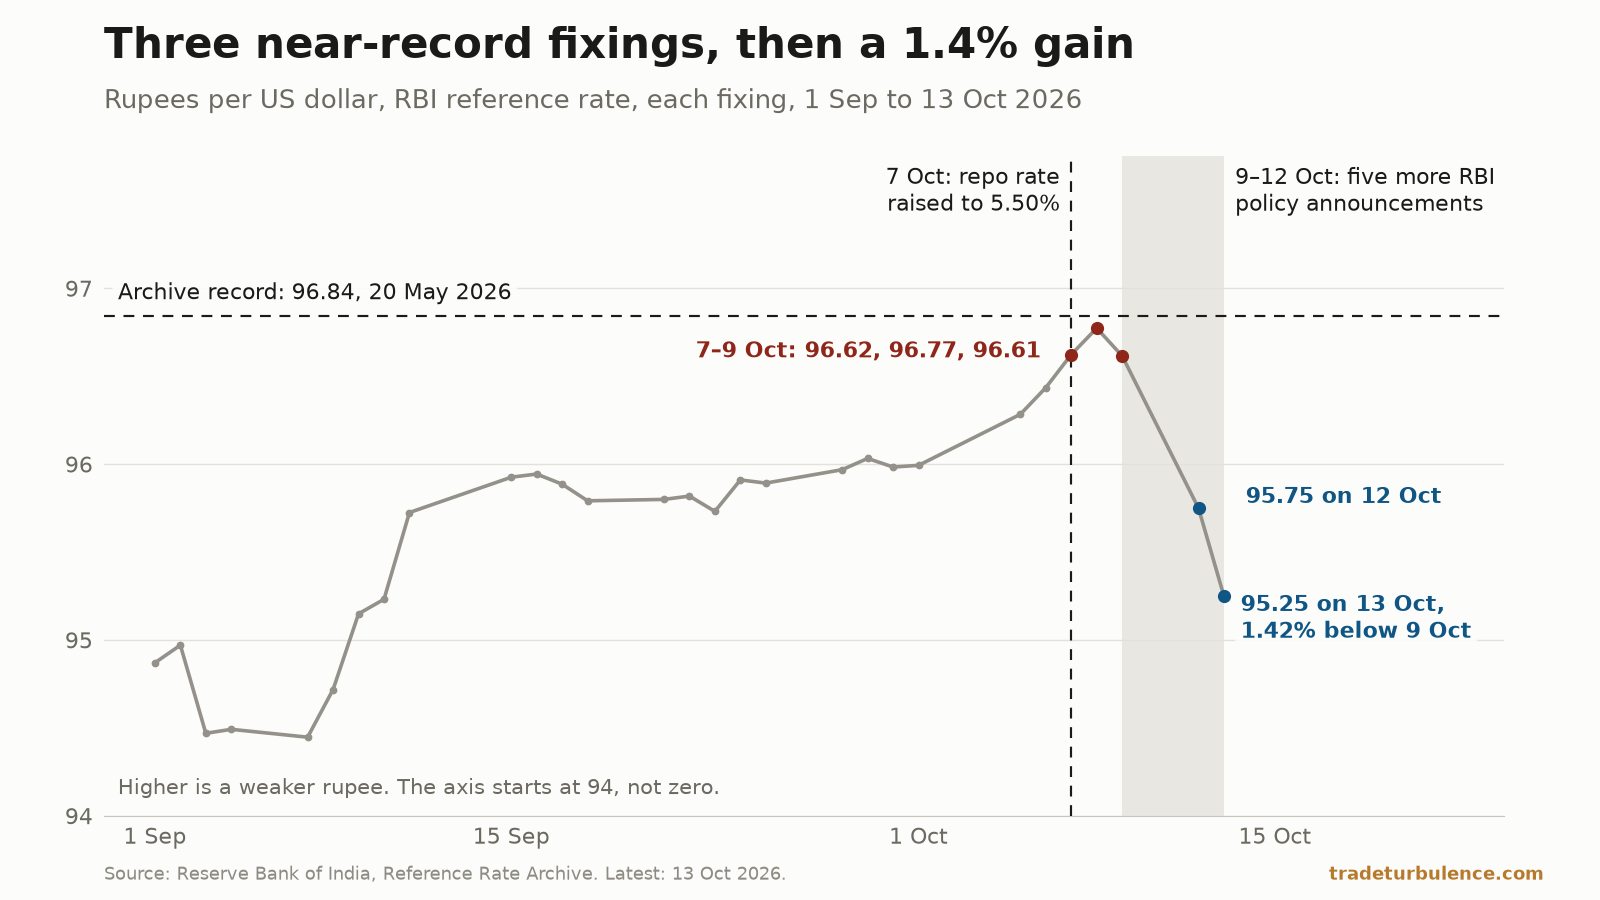
- The rupee fell through a rate rise, then rose 1.4% in two fixings
Three of the RBI archive's four weakest rupee fixings came on 7–9 October. From the 9th to the 13th, across five policy announcements, the rupee gained 1.4%.
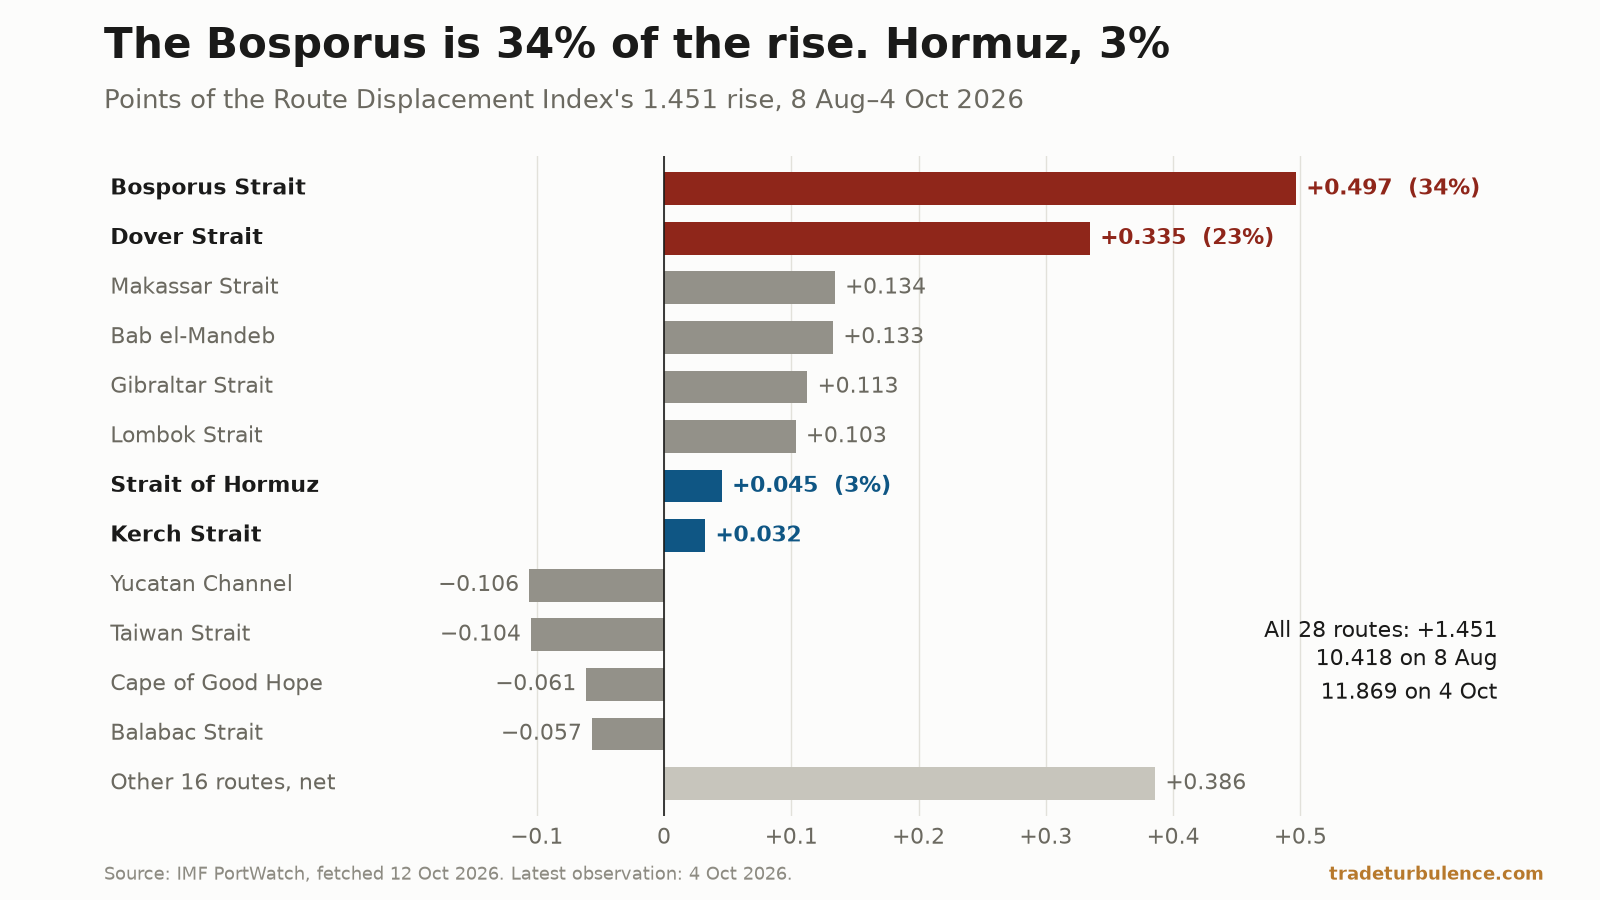
- The Bosporus is 34% of the rise in route displacement. Hormuz, 3%
On counts fetched 12 October, the Route Displacement Index rose from 10.42% on 8 August to 11.87% on 4 October. The Bosporus and Dover supplied 57%; Hormuz, 3%.
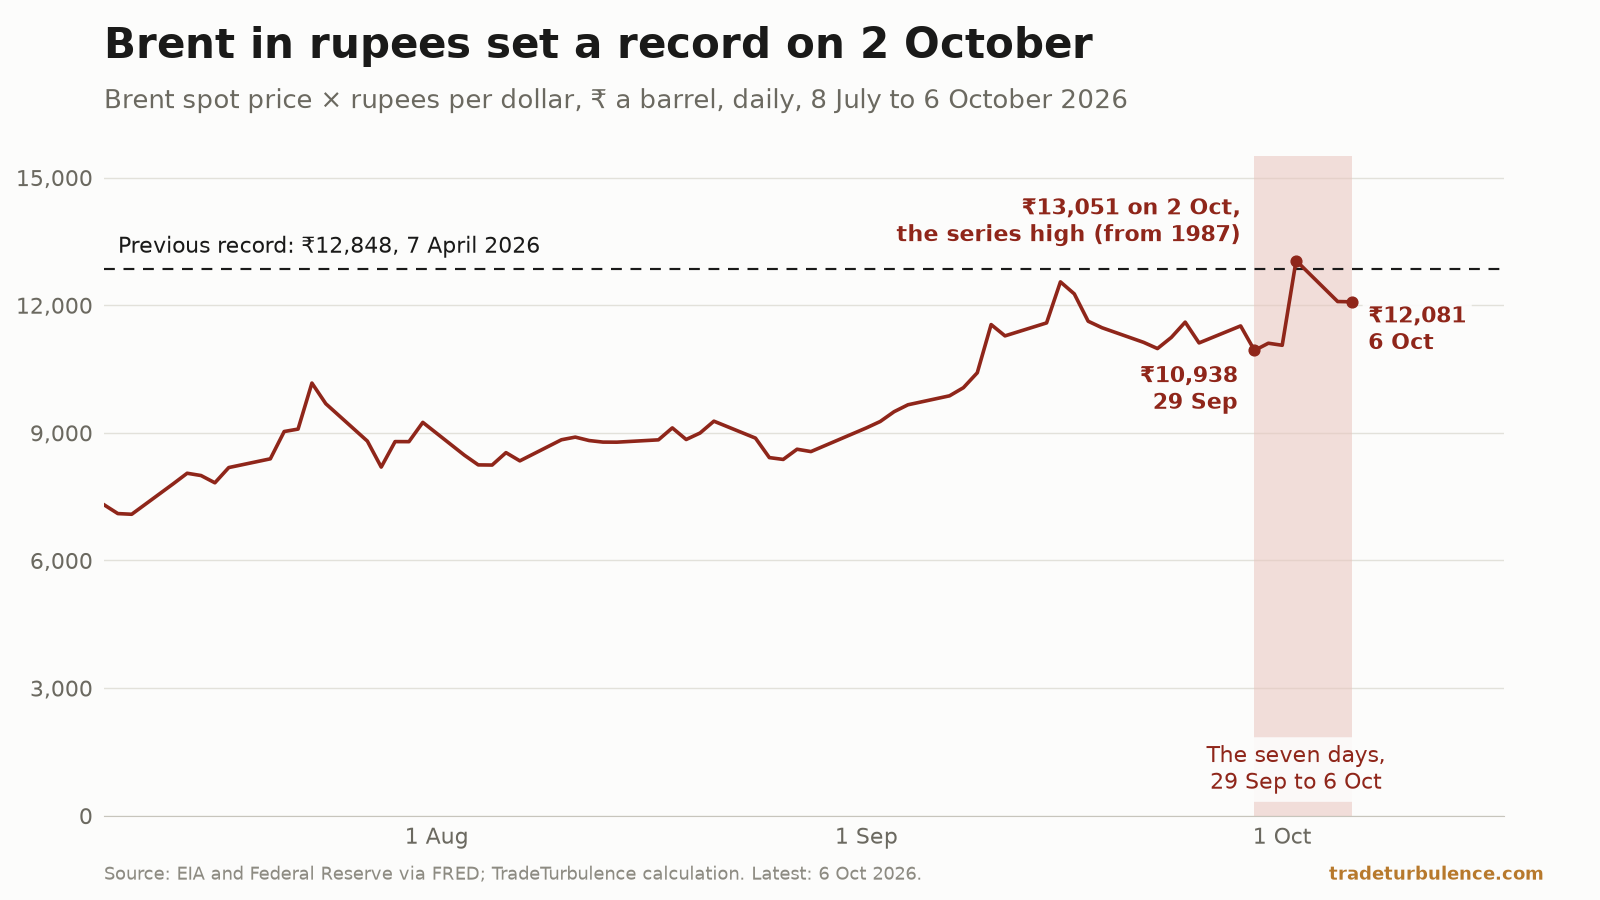
- Brent rose 10% in a week. In rupees it set a record
Brent was $125.44 on 6 October, 10.1% above 29 September. On 2 October a barrel cost ₹13,051, the most in a series from 1987; by 6 October, 7.4% less.
Explore
Stress Index
Five pillars, one number
Shipping, supply chains, energy, money and tariffs, scored against the 2010s. Daily since 2008.
Chokepoints
28 straits and canals
Daily transits against two baselines, from satellite ship tracking.
Outlook
The next official numbers
Nowcasts with honest ranges, a scored record and the agencies' own forecasts.
Indicators
Oil, currencies, yields
Each priced against its own five years, so "high" means high for it.
Topics
Routes to watch
TradeTurbulence is an independent publication built on its own open data: the TradeTurbulence Stress Index (4902 daily readings since 2008), a chokepoint board, a forecast ledger and a set of indicators. Every number traces to a named public source you can re-fetch, and every method — with what it cannot see — is published.