The rupee gained 1.8% in a week. It is still weak
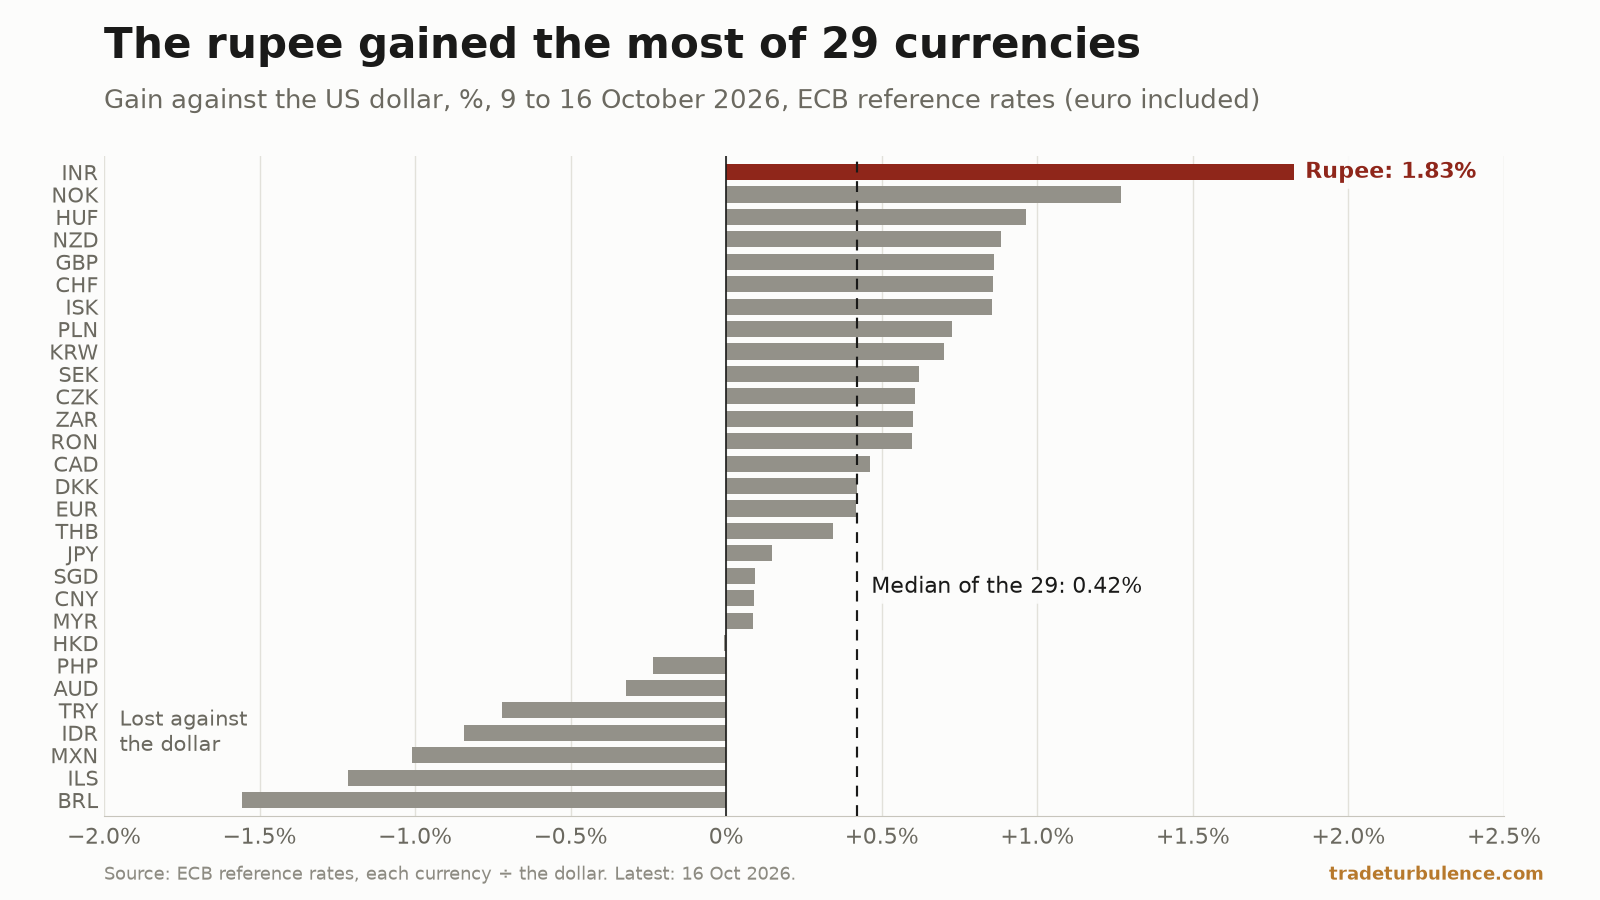
On ECB rates a dollar bought 1.83% fewer rupees on 16 October than a week before, the most of 29 currencies. Only 96 days in five years had a weaker rupee.
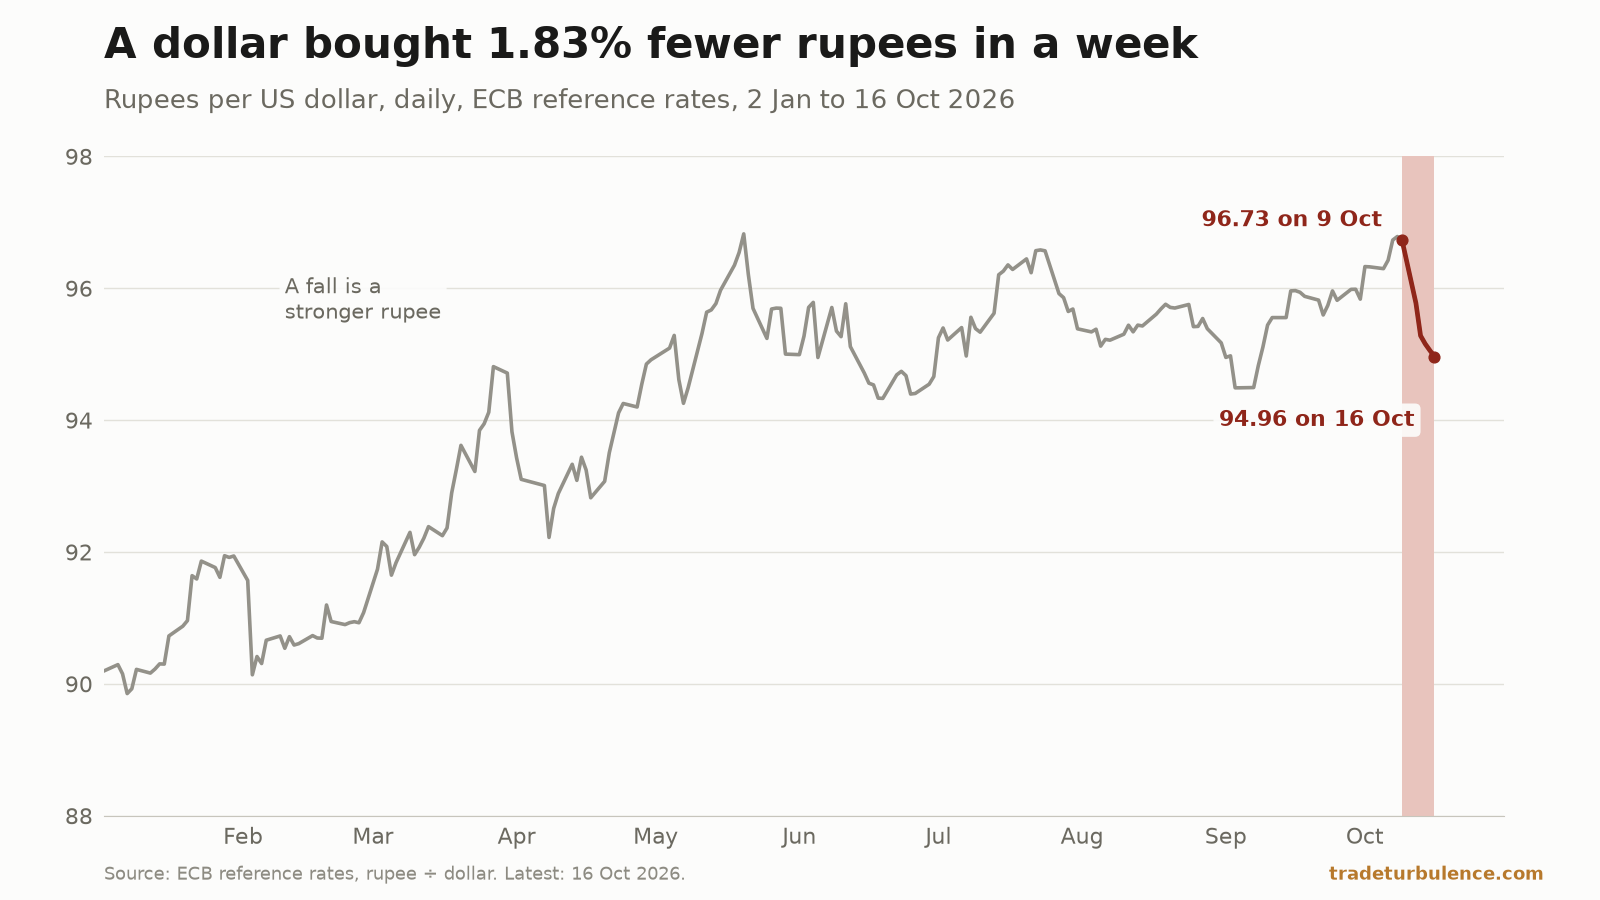
A dollar bought 94.96 rupees on 16 October 2026 by the European Central Bank’s reference rates, down from 96.73 on 9 October: the rupee gained 1.83%, the most of the 29 currencies, the euro included, that the ECB’s rates price against the dollar; their median gained 0.42%. The Reserve Bank of India’s fixing puts the gain at 1.65%. The rupee is still weak: on only 96 of the 1,260 trading days of the past five years did a dollar buy more of it.
The rupee gained more against the dollar than any of 28 other currencies
The ECB rates each currency against the euro; dividing the rupee’s rate by the dollar’s gives rupees per dollar. “Gained 1.83%” means a dollar bought 1.83% fewer rupees.
More than half the move came on the first day: 95.78 on 12 October, 0.99% below 9 October, then 95.28, 95.16 and 95.06, and 94.96 on 16 October. That is the strongest the rupee has been since 8 September, on the ECB’s series and on the RBI’s.
Other currencies gained less: 21 of the 29 rose against the dollar. The median gain was 0.42%; the euro’s was 0.42%, the yen’s 0.15% and the yuan’s 0.09%. The next best after the rupee was the Norwegian krone, at 1.27%.
Our 13 October piece counted five RBI policy announcements on 9–12 October. Four came before the 12 October fixing; the fifth was stamped late that night. That is timing; the data do not say why the rupee rose.
The rupee is still near the weak end of its range. Of the 1,260 trading days from 4 October 2021, a dollar bought more rupees on 96. The page’s band is Very high, the weakest-rupee end of its five. The weakest day in the Fed’s series, which starts in 1973, is 20 May 2026, at 96.82; 16 October is 1.92% below it.
Priced in rupees, oil got cheaper. Brent was $126.55 on 14 October, its latest print as fetched on 19 October, 0.44% above 7 October. On the ECB’s rates at both ends, Brent in rupees fell 1.20% over the same days, to ₹12,042.1, 7.73% below ₹13,051 on 2 October, the highest in a series from 1987.
On the ECB’s rates no week since 2020 was larger. On the RBI’s, two this year were
The RBI’s reference rate went from 96.6149 on 9 October to 95.0194 on 16 October, a gain of 1.65%. The Fed’s series had no rate after 9 October when fetched on 19 October.
Over windows of exactly seven calendar days, the ECB’s rates have no gain as large as this week’s since the seven days to 28 August 2020. The RBI’s fixing had two weeks this year larger than its own 1.65%: 1.71% in the seven days to 5 February and 1.69% to 6 April. The Fed’s series had 1.835% in the seven days to 3 April.
The April weeks straddle Easter. The ECB published no rates on 3 or 6 April, and the Fed’s rate for 3 April repeats 2 April’s. From 27 March to 2 April the ECB’s rates showed a gain of 1.80%, short of this week’s and of the Fed’s. The ECB’s “largest since 2020” rests on that margin and on its calendar.
The Stress Index eased 1.7 points, and money and finance gave 1.5 of them
The Stress Index (v3) read 81.4 on 15 October, in its Severe band, against 83.1 on 8 October. Money and finance fell from 41.6 to 33.9, in the band the index calls Settled. At its 20% weight that is 1.54 of the 1.7 points. It scores the broad dollar’s 63-day change, the St. Louis Fed’s stress index and the VIX. Energy costs eased from 80.4 to 79.7. Shipping routes at 95.8, supply chains at 99.2 and trade policy at 99.3 did not move, and all three are Severe.
All 11 readings from 1 to 15 October were at or above 80, the floor of the Severe band. The index has read 80 or more on 72 weekdays since its series begins in 2008, every one of them in 2026. The highest reading of its 2010–2019 reference decade was 78.4; the record is 86.7, on 31 March 2026.
The index is rebuilt daily, so past readings move: last week’s piece quoted 82.5 for 8 October, and the 19 October build has 83.1.
Kerch saw two ships after 38 days without one, and route displacement came off its record
Route figures are 30-day averages of the vessels IMF PortWatch counts from AIS signals, to 11 October.
PortWatch counted 2 transits through the Kerch Strait on 11 October, the first since a single ship on 2 September; none was counted on the 38 days between. The 30-day average is 0.07 a day, against a 2019–23 baseline of 37.6.
The Route Displacement Index, the share of traffic through 28 chokepoints on a different route than in 2019–23, was 11.6% on 11 October, down from 11.9% on 4 October. The 4 October reading, 11.869%, is the record in a series that starts in 2019. The index has been above 10% for 67 days in a row.
The Bosporus climbed back above half its baseline: its 30-day average was 50.33 a day on 11 October, against 49.1, after 48.97 on 3 October. The Strait of Hormuz averaged 3.4 a day, 95.9% below its baseline, with daily counts of 8, 2, 6, 4, 3, 4 and 2 over 5–11 October. Bab el-Mandeb was at 27.3, 55.4% below its baseline, and the Suez Canal at 40.93, 32.1% below.
On TradeTurbulence this week
Newest first, then last week’s issue, whose markers this one checks.
Trump waived a 100% tariff on Russia’s top oil and gas buyers. Rubio named India (18 October). The order names no buyer; China and India sold the US $359bn of goods in the year to August. Since: nothing measured has changed. The tariff data it used still end in August, and its watch item, Rubio’s visit to India, runs to 22 October.
Euro-area inflation is 3.8%. Without energy, it is 2.3% (17 October). Excluding energy, inflation was 2.3%, as in January. Since: no new release; the ECB decides on 29 October.
Copper is a record in real terms. Most base metals are not (17 October). Copper averaged $14,474 a tonne in September, a World Bank record from 1960, and gave 65% of base metals' 12-month rise. Since: no new Pink Sheet; the next is due on 3 November if the World Bank keeps its timing.
Bab el-Mandeb fell below its 2024 low. Suez did not. (16 October). Its 30-day traffic hit 25.5 a day on 23 September, the lowest in PortWatch’s series from 2019; tankers were 61% of the fall. Since: no new data. Its test, 31.0 a day over 12–18 October, waits for PortWatch’s next batch.
The surcharge ended in July. The deficit began widening in May. (14 October). The US goods deficit reached $136.6bn in August, its widest since March 2025. Since: no new release; September’s trade data are due on 4 November.
A Stress Index of 80 is higher than any day of 2010–2019 (13 October). No weekday of 2010–2019 reached 80; 68 weekdays of 2026 had, as the index was built on 13 October. Since: the rebuild reads 81.0 for 9 October, not the 82.3 quoted; through 15 October the count is 72.
The rupee fell through a rate rise, then rose 1.4% in two fixings (13 October). From the 9th to the 13th, across five policy announcements, the rupee gained 1.4%. It also reported India’s September inflation, 5.54% against 4.83% in August, released on 12 October. Since: on the RBI’s fixing the gain grew to 1.65% by 16 October, and the fixing never went back to 96.61, the level the piece set. On 19 October it was 94.7691.
The Bosporus is 34% of the rise in route displacement. Hormuz, 3% (12 October). The index rose from 10.42% on 8 August to 11.87% on 4 October, 57% of it from the Bosporus and Dover. Since: the run above 10% reached 67 days, as the piece said it would if every new day held; the Bosporus is above 49.1, and Hormuz has not been back at 5.30.
Brent rose 10% in a week. In rupees it set a record (12 October), last week’s issue. Kerch had its first vessels since 2 September; the Bosporus did not fall back under 49.1; the displacement index set no new high. Brent’s highest print was $130.18, short of $134.92, and the rupee never reached 96.82. Our nowcast for September CPI gasoline was 8.22% on the month (80% range 6.48 to 9.97; BLS published it on 14 October; 8 of the last 12 inside the range, a backtest); BLS’s 9.1% was inside it. The range for September import fuel prices missed, and as of 19 October the outlook page withholds that model because “its 80% range held only 6 of the last 12 outcomes”.
Outside the week, on 19 October, the site added topic guides for Supply chains and Oil markets, and a piece on the US 10-year Treasury yield, which was 5.10% on 15 October, down from 5.22% on 8 October.
What we missed
Events the site did not cover, newest first, each linked to its issuer’s record. OPEC’s monthly report is not among them: its site refused our requests, and we found its October figures in only one outlet.
16 October: US import prices rose 8.1% in a year. The Bureau of Labor Statistics reported a rise of 1.1% in September and 8.1% over 12 months, “the largest 12-month advance since the index increased 8.8 percent for the year ended July 2022”. Import fuel rose 34.5% on the year, nonfuel imports 6.0%. The site’s effective tariff rate was 7.753% on 15 October; we have not tested how the two relate.
15 October: TSMC’s revenue rose 50.9% on a year. TSMC’s filing with the SEC puts third-quarter revenue at NT$1,494.24bn, or $46.72bn, up 41.2% in dollars, and expects US$52.3bn to US$54.3bn in the fourth quarter. The monthly figures on the site’s TSMC page add up to the same quarter. We have not tested what the guidance implies.
15 October: China’s exports rose 36.3% on a year. By the customs administration’s tables, China exported $447.18bn in September and imported $313.65bn, up 31.0%, a surplus of $133.53bn; for January–September it was $938.11bn. Exports to the US were $47.88bn and imports from it $13.87bn, by its country table. The date is that of the English edition. The US charged 22.77% on Chinese goods in August, the latest month on its tariff page. We have not compared China’s records with the US’s.
14 October: US inflation reached 3.7%. BLS reported that consumer prices in the United States rose 0.6% in September, seasonally adjusted, and 3.7% over 12 months, from 3.4% in August. “The index for gasoline rose 9.1 percent in September, accounting for over half of the monthly all items increase”. Excluding food and energy, prices rose 2.6% over the year. We have not split the rise as our euro-area piece did.
What this cannot settle
Why the rupee rose. The series record when and how much. Four of the RBI’s five announcements came before the gain’s first day and one during it; the data do not connect them.
How rare the week was. It depends on the source and the window. On exactly seven-day windows the ECB’s rates have none larger since August 2020, by 0.022 points over a week that Easter cut short; the RBI’s fixing has two larger this year. As fetched on 19 October, the Fed had not published the week.
“The week” is each series’ own seven days. The rupee’s ran to 16 October, the Stress Index’s to 15 October, Brent’s to 14 October and the routes’ to 11 October.
Route counts are 30-day averages of AIS signals. A ship with its transponder off is not counted.
The events under “What we missed” are reported, not analysed. Each is taken from its issuer’s record as read on 19 October 2026.
What to watch
19 October, 4:15 p.m. in Washington. The Fed publishes its rates for the week to 16 October. At 94.96 or lower for 16 October its series would show a week as large as the ECB’s, and at 94.95 or lower a larger one than its week to 3 April. EIA’s gasoline price for 19 October also comes out: our range is $4.35 a gallon (80% range $4.11 to $4.58; EIA publishes it on 19 October; 40 of the last 52 inside the range, a backtest).
20 and 21 October. PortWatch runs about a week behind; its next batch tests Bab el-Mandeb’s 31.0 a day. The ONS publishes UK labour figures on 20 October and September inflation on 21 October, at 7:00 UK time; on 19 October the UK page showed August’s 3.1%. The RBI’s minutes are due on 21 October.
26 October. Our range for US regular gasoline is $4.21 a gallon (80% range $3.98 to $4.45; EIA publishes it on 26 October; 40 of the last 52 inside the range, a backtest). As of 19 October the live ledger had scored none of that model’s forecasts.
96.61, 96.82 and $137.43. An RBI fixing back at 96.61 would undo the week; 96.82 is the weakest rupee in the Fed’s series. At the 16 October rate, Brent would have to reach $137.43 for the rupee price to match its record.