Brent rose 10% in a week. In rupees it set a record
Brent was $125.44 on 6 October, 10.1% above 29 September. On 2 October a barrel cost ₹13,051, the most in a series from 1987; by 6 October, 7.4% less.
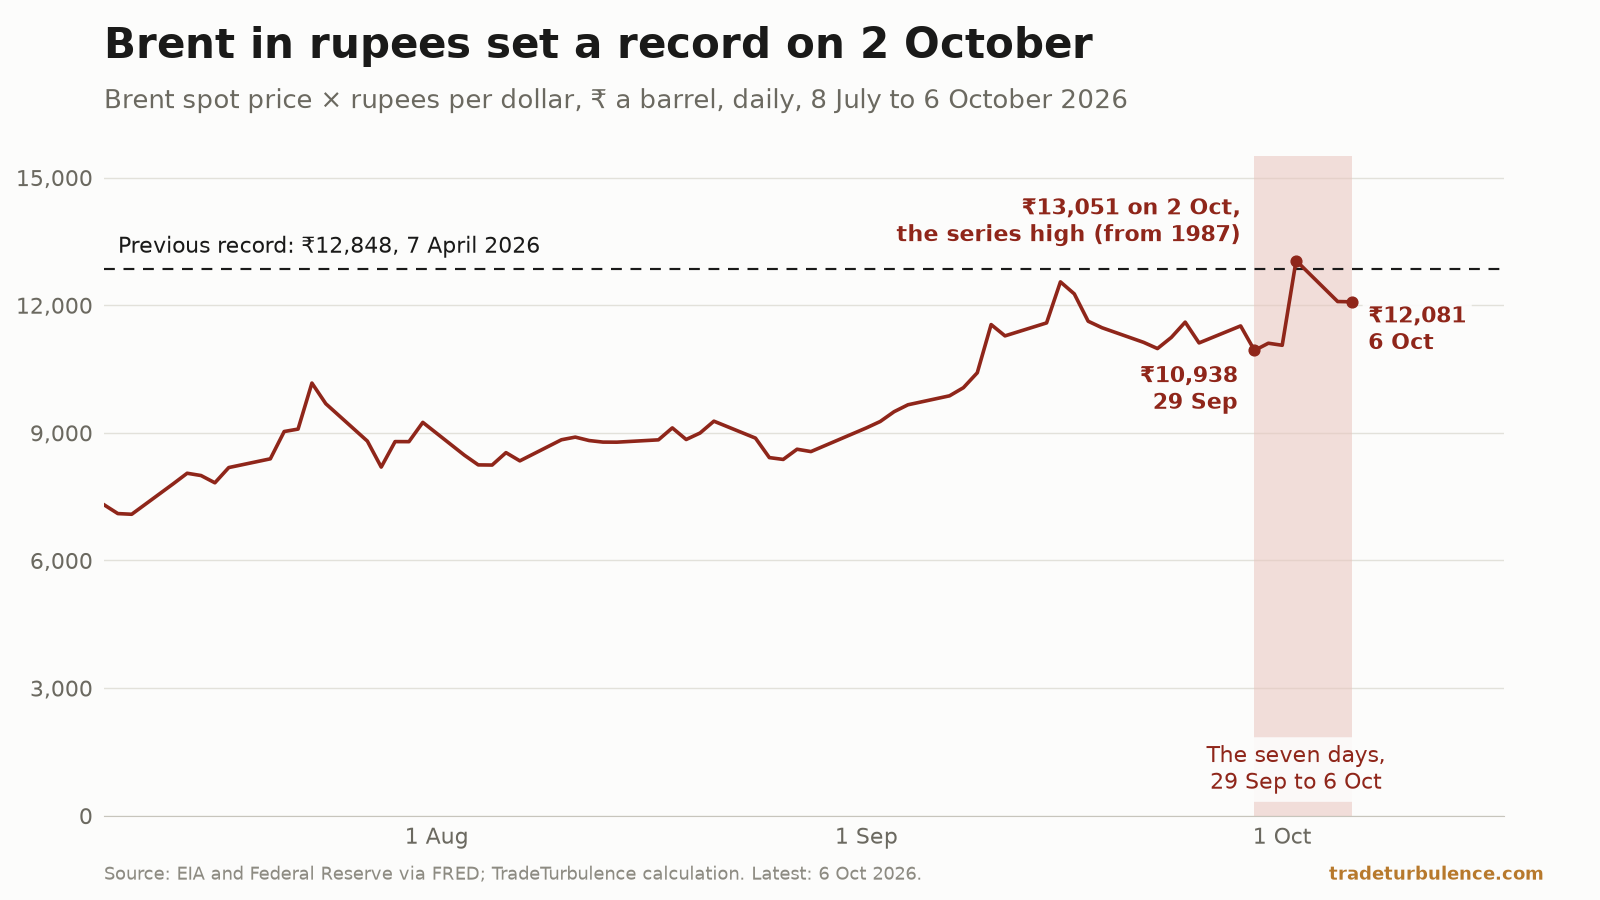
Brent crude was $125.44 a barrel on 6 October 2026, the latest price published: 10.1% above its 29 September print. One day’s rise was bigger than the whole gain. On 2 October the price rose $20.69, the largest one-day dollar rise in a series that starts in 1987, to $135.51; the next print took $10.00 back. Priced in rupees, the 2 October barrel cost ₹13,051, the highest in the same span, though in dollars it stopped $2.70 short of the year’s high. The Stress Index (v3) read 82.5, Severe, on 8 October.
One day’s $20.69 rise was 1.8 times the week’s gain
Every series here is measured against its own reading seven days earlier, and each has its own lag, so both dates are given each time. The EIA’s Europe Brent spot price, distributed through FRED, had 6 October as its latest print when fetched on 12 October.
Its seven days run from $113.96 on 29 September to $125.44 on 6 October: up $11.48, or 10.07%. One print alone was 1.8 times that. On 2 October the price went from $114.82 to $135.51, a rise of $20.69, or 18.0%. On 5 October it fell $10.00, or 7.4%, to $125.51, and on 6 October it moved by seven cents.
No one-day rise in the series is larger in dollars. The next largest is $11.47, on 10 September 2026. The honest context is that a dollar record set at $135 owes something to the price level. By percentage, which allows for that, seven rises from one print to the next are bigger, four of them in April and May 2020.
A seven-day rise at least as large has occurred on 290 of 9,097 days since 1987, and 39 of the 290 are in 2026. Only two prints, 5 and 6 October, fall inside the calendar week, and both are below 2 October’s.
In rupees the 2 October barrel was the dearest in the series
The site also publishes Brent in rupees for India: the EIA’s dollar price multiplied by the Federal Reserve’s daily rupee rate. On 2 October that came to ₹13,051 a barrel, the highest of 9,102 days back to May 1987. It passed the ₹12,848 of 7 April 2026 by 1.6%.
In dollars the order is reversed. The 7 April print, $138.21, is Brent’s high for the year, and 2 October stopped $2.70 below it. The difference is the exchange rate: 92.96 rupees to the dollar on 7 April, 96.31 on 2 October.
By 6 October the rupee price was ₹12,081, 7.4% below the record and 10.45% above 29 September. Among the site’s seven indicators, the headline Stress Index and the Route Displacement Index, none moved by a larger percentage over its latest seven days. Three of the 28 routes did, each carrying fewer than seven ships a day; one is described below. The currency’s share is small: the rate paired with the prices moved 0.34%, and the 5 and 6 October prices are paired with the Fed’s 2 October rate, the latest it had published.
The rupee’s last reading of the week, from the ECB’s reference rates, was 96.73 to the dollar on 9 October. That is 0.44% weaker than the Fed’s 96.31 of 2 October, and 0.09 short of the weakest daily rate in the Fed’s series, which starts in 1973: 96.82, on 20 May 2026.
The dollar index rose 0.88% to 121.38 between 25 September and 2 October. The yen was 158.25 to the dollar on 9 October by the ECB’s rates, 0.28% weaker than the Fed’s 157.81 of 2 October.
The Stress Index has been Severe on every reading since 1 October
The Stress Index (v3) read 82.5 on 8 October, in its Severe band, against 80.7 on 1 October: up 1.8 points. It crossed 80, the floor of that band, between 30 September, when it read 79.6, and 1 October. All six readings from 1 to 8 October are above it.
The index has spent 67 days at or above 80 since its series begins in 2008, and every one of them is in 2026. The highest reading of its 2010–2019 reference period was 78.4, so 82.5 is higher than every day of that decade. The record is 86.7, set on 31 March 2026.
Two of the five pillars moved by more than 0.1 in the seven days. Energy costs rose from 76.2 to 79.7, one band below Severe. One of the two things that pillar scores is Brent’s 20-day realised volatility, which stood at 88.1% annualised on 6 October, above anything in the reference decade. Money and finance rose from 33.8 to 39.3, still in the band the index calls Settled. The other three moved by 0.1 or less: shipping routes 95.9, supply chains 99.2 and trade policy 99.3, all Severe.
Kerch went 30 days without a ship and the Bosporus hit a series low
Route figures are 30-day averages of vessels that IMF PortWatch counts from AIS signals, published to 4 October. A week’s change is a change in a monthly average, not the week’s own traffic.
The Route Displacement Index, the share of traffic through 28 chokepoints running on a different route than in 2019–23, was 11.9% on 4 October, against 11.6% on 27 September and a baseline mean of 3.84%. That is the highest in its series, which starts in 2019, and the 60th day in a row above 10%.
PortWatch counted no vessel in the Kerch Strait in the 30 days to 4 October. The last was a single ship on 2 September. Before the window that ended on 2 October, the series, which starts in 2019, had no 30 days without a transit. The strait’s 2019–23 baseline is 37.6 a day. The August piece on Kerch counted 34 vessels in the 30 days after 10 July.
The Bosporus averaged 49.27 transits a day on 4 October, 6.0% fewer than a week earlier and 49.8% below its baseline. A day before, at 48.97, it reached the lowest 30-day average of a series that starts in 2019 and, for that one day, less than half its baseline. That briefly put four routes under half their normal traffic at once, the most the series has recorded. On 4 October it was three again: Bab el-Mandeb, Kerch and the Strait of Hormuz.
Hormuz averaged 3.6 transits a day, 95.6% below baseline, and the Cape of Good Hope 87.6, 82.2% above.
On TradeTurbulence this week
Both pieces ran on 11 October.
Brent rose 23% in a month. The Hormuz counts point both ways. Brent rose 22.7% between 4 September and 6 October, while two public tallies of Hormuz traffic disagreed: PortWatch has 109 transits in September, and Lloyd’s List Intelligence, counting a different set of ships, at least 477. What has changed since: neither series has a newer observation. As fetched on 12 October, Brent’s latest print is still 6 October and PortWatch’s still 4 October, so the markers the piece set have not been tested.
The Rhine at Kaub has spent 41 days below its 2018 record. The Kaub gauge averaged 7.8 cm on 10 October, its 41st day of 2026 below the 25 cm low of 2018; from 2000 to 2025 no day in the agency’s data was under it. What has changed since: 11 October averaged 15.0 cm on the waterways agency’s raw readings, higher than the day before and still under 25 cm. That makes 42 days this year and 25 in a row.
What we missed
Six events the site did not cover, newest first, each linked to its issuer’s own record or, for one post on X, to two outlets that quote it.
9–11 October: Washington licensed Russian diesel. On 9 October the US Treasury’s Office of Foreign Assets Control issued General License 135. It authorises transactions “related to the sale, delivery, offloading, or importation, including importation into the United States, of diesel fuel of Russian Federation origin” until 12:01 a.m. eastern daylight time on 7 April 2027, and excludes debits to accounts of Russia’s central bank, National Wealth Fund or finance ministry at US financial institutions. On 10 October the Russian Government said it had partially lifted its ban on diesel exports, in fulfilment of agreements between Presidents Putin and Trump, and that this would allow 500,000 tonnes to be sent to the world market “at this stage” (translated from Russian by TradeTurbulence). On 11 October seven senators of both parties said the decision “runs directly counter to that law”, the 2022 ban on Russian energy imports their statement describes. We have not measured any effect on prices: when checked on 12 October, EIA’s weekly retail diesel series had no reading after 5 October, and its next was due on 14 October.
8 October: the WTO raised its goods-trade forecast. The World Trade Organization’s Global Trade Outlook and Statistics now expects merchandise trade volume to grow 3.9% in 2026, up from the 1.9% it forecast in March, and 4.1% in 2027. It lowered its 2026 forecast for services trade to 3.3% from 4.8%, and projects a 17.2% fall in the Middle East’s merchandise exports this year. The Route Displacement Index, 11.9% on 4 October, measures where ships go and not how much they carry; we have not compared the two.
7–8 October: India’s telecom ministry defended its satellite licensing. On 8 October the Ministry of Communications said that licences had been granted to three satellite services, that a security assessment was under way for all three, and that “the suggestion that the framework or its application is unfair or discriminatory is baseless and misconceived”. The release names neither the post it answers nor its author. ThePrint and the Press Trust of India report that it was Elon Musk’s, and that SpaceX’s chief executive wrote on X on Wednesday 7 October that Starlink was being blocked in India by “certain oligarchs”. The site has no series on India’s broadband market, and we have tested neither claim.
7 October: the Reserve Bank of India raised its policy rate. The RBI’s Monetary Policy Committee voted unanimously to raise the repo rate by 25 basis points to 5.50% and changed its stance to “calibrated tightening”; two members wanted the stance kept at neutral. Its resolution cites “sharp volatility in crude oil prices”. The rupee was 96.73 to the dollar on 9 October. The site’s series had no reading between 2 and 9 October, so we have not tested whether the decision moved the currency.
6 October: the US trade deficit widened. The Census Bureau and the Bureau of Economic Analysis reported that the United States ran a goods and services deficit of $105.6bn in August, up $12.7bn from a revised $92.8bn in July. Imports rose $17.2bn to $420.8bn and exports $4.5bn to $315.2bn. The site’s effective tariff rate, which divides customs duties by goods imports, was 7.816% on 8 October. We have not tested what the August figures do to it.
5 October: an executive order on diesel tax. President Trump signed Executive Order 14435, “Emergency Tax Relief on Diesel Fuel”, directing the Treasury Secretary to use his authority “to defer certain diesel fuel tax payment obligations and to provide penalty relief to the extent permitted by law”. The deferral would cover taxes incurred from 5 October through 31 December 2026, if the Secretary determines within five days that the law authorises it. EIA’s retail diesel price was $6.199 a gallon on 5 October, the day of the order; the site’s own diesel range on the Outlook page was withheld as of 11 October. We have not measured the order’s effect.
What this cannot settle
Why Brent moved. The series records an 18% rise on one day and a 7% fall on the next print. Nothing in it says why, and this piece offers no cause.
“The week” is seven days of each series, not seven shared days. Brent’s seven days end on 6 October, the routes’ on 4 October, the Stress Index’s on 8 October and the rupee’s on 9 October.
Both records are nominal. Neither is adjusted for inflation, and the Brent series starts in May 1987. It is the EIA’s spot assessment, not the futures contract. The rupee price is arithmetic on two published series, not what any refiner paid.
Route counts are 30-day averages of AIS signals. A ship with its transponder off is not counted. Zero at Kerch means none counted.
The events under “What we missed” are reported, not analysed. Each is taken from its issuer’s text, or for the post on X from two outlets, as read on 12 October 2026.
What to watch
13 October, PortWatch’s weekly batch. PortWatch publishes on Tuesdays. Three things to read in it: whether any vessel is counted at Kerch, which would end the 32 days to 4 October without one; whether the Bosporus average falls back under 49.1 a day, half its baseline; and whether the Route Displacement Index sets another high above 11.87%.
14 October, two releases. Our nowcast for September CPI gasoline is 8.22% on the month, seasonally adjusted (80% range 6.48 to 9.97; BLS publishes it on 14 October; 8 of the last 12 inside the range). The same day EIA publishes its first weekly retail diesel price since General License 135.
16 and 19 October. Our nowcast for September import fuel prices is 18.0% on the month, not seasonally adjusted (80% range 5.4 to 30.5; BLS publishes it on 16 October; 7 of the last 12 inside the range). Our range for US regular gasoline on 19 October is $4.35 a gallon (80% range $4.11 to $4.58; EIA publishes it on 19 October; 40 of the last 52 inside the range). All three records, the CPI gasoline one included, are backtests. As of 11 October the live ledger on the Outlook page had scored no forecast.
$134.92 and $138.21. At the 9 October exchange rate, a Brent print of $134.92 would match the rupee record; the 6 October print is $9.48 below that. The year’s high in dollars is $138.21. For the rupee the line is 96.82.