Topic
Supply chains
Where goods physically move and what happens when a link is priced out: semiconductors, shipping and the substitution that follows.
The guide to Supply chains
Figures as of 15 October 2026. Updated 19 October 2026. AI-assisted, reviewed by Hritik.
Supply chains are the links between where goods are made and where they are bought, and the measure this site uses to size the strain on them is the New York Fed’s Global Supply Chain Pressure Index. It read 1.28 standard deviations above its average in September 2026, against a peak of 4.43 in December 2021. Only 32 of the 345 months since January 1998 have read higher, and outside 2026 no month since December 2022 has read as high. September’s reading puts the Supply chains pillar of the Stress Index at 99.2; the index (v3) read 81.4, Severe, on 15 October 2026.
Supply-chain pressure was above its average in every month from December 2025 to September 2026
The index combines 27 monthly series: delivery times, order backlogs and purchased stocks from manufacturers’ surveys in seven economies (China, the euro area, Japan, South Korea, Taiwan, the UK and the US), plus two global shipping rates and four airfreight price indices. Each series is cleaned, as far as possible, of the part that moves with demand, using the same surveys’ questions on new orders and purchases, and the index is what the cleaned series have in common. The method is set out in a New York Fed staff report of May 2022. Zero is the index’s average, and a reading of 1.0 is one standard deviation above it.
It has read above zero in all nine months of 2026. It started the year at 0.36 in January, rose to 1.81 in May, the year’s high, eased to 0.93 in July, and read 1.20 in August and 1.28 in September. The run of months above average began in December 2025; November 2025 read −0.21.
The 32 months that read higher than September 2026 fall in five years: one in 2011, seven in 2020, 12 in 2021, 10 in 2022 and two in 2026, April and May. The five highest readings all fall between October 2021 and April 2022, led by December 2021’s 4.43. The series’ lowest reading was −1.56, in May 2023.
On 15 October 2026 the Supply chains pillar read 99.2 and carried 19.8 of the Stress Index’s 81.4 points
In version 3 of the Stress Index the Supply chains pillar is this one series, and it is 20% of the total. The methodology scores a series by the share of a reference period’s readings that sit below its latest value; for this pillar the reference is 2010–2019. September’s 1.28 was higher than 119 of that decade’s 120 months. The one higher month was April 2011, at 1.55. That puts the pillar at 99.2. Between the New York Fed’s monthly releases the Stress Index carries the last month forward.
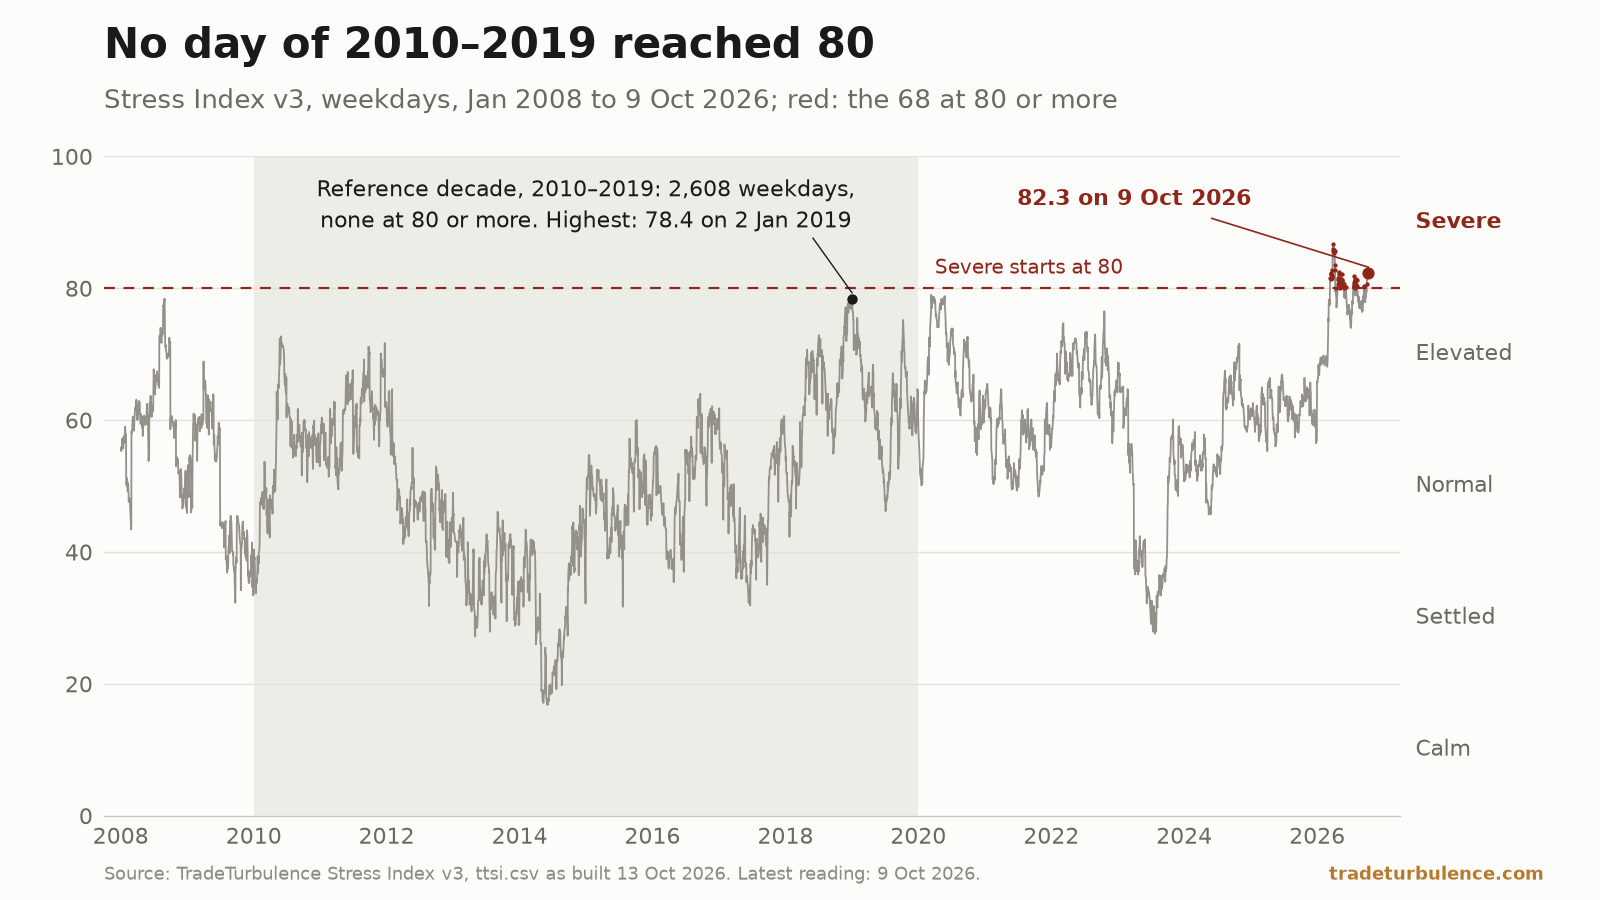
On 15 October 2026 the index read 81.4, Severe, and the Supply chains pillar supplied 19.84 of those points, 24.4% of the reading. It was one of three pillars in severe territory, with Shipping routes at 95.8 and Trade policy at 99.3. Energy costs read 79.7 and Money and finance 33.9. That Trade policy score is partly older than its date. Its uncertainty input, 40% of the pillar, is the trade category of the Economic Policy Uncertainty index from Baker, Bloom and Davis. On 15 October its latest value was for August 2026, and the Stress Index carries that value forward until a newer month is published. The Stress Index’s highest reading in its coverage, which starts in January 2008, was 86.7 on 31 March 2026. The explainer on what a reading of 80 means found on 13 October that no weekday of 2010–2019 reached 80, and that 68 weekdays of 2026 had, as the index was built that day.
A record 11.87% of chokepoint traffic was on a different route in the 30 days to 4 October 2026
Shipping routes are the index’s largest pillar, at 25%. One of its two inputs is the Route Displacement Index: the share of traffic through 28 maritime chokepoints that is on a different route than in 2019–2023, over 30 days, computed from IMF PortWatch satellite transit counts. On PortWatch’s counts as fetched on 18 October it read 11.87% for the 30 days to 4 October 2026, the highest of 2,812 daily readings since 30 January 2019, and 11.65% for the 30 days to 11 October, the latest. It has been above 10% for 67 days in a row, from 6 August to 11 October, and on no day before that. Its average from January 2019 to October 2023 is 3.84%, and the 11 October reading is 3.03 times that.
The Route Displacement Index measures shares of traffic, not ships, and when total traffic falls a route can lose ships yet gain share. On 30-day averages to 11 October the 28 routes together carried 7.2% fewer transits a day than in 2019–2023. Counted in transits, 14 of the 28 ran above their 2019–2023 baseline and 14 below. The Malacca Strait gained the most ships, 43.9 a day more than its baseline, and the Cape of Good Hope 38.3 more. The Cape’s rise of 79.6% is the largest percentage gain among the 26 routes that normally carry at least five ships a day. The Strait of Hormuz lost the most, 78.7 ships a day, and ran 95.9% below its baseline. Bab el-Mandeb ran 55.4% below and the Suez Canal 32.1% below. The Kerch Strait averaged 0.1 ships a day, 99.8% below. On 3 October four routes that normally carry at least five ships a day were below half their 2019–2023 level, the most on any day since 30 January 2019; on 11 October it was three.
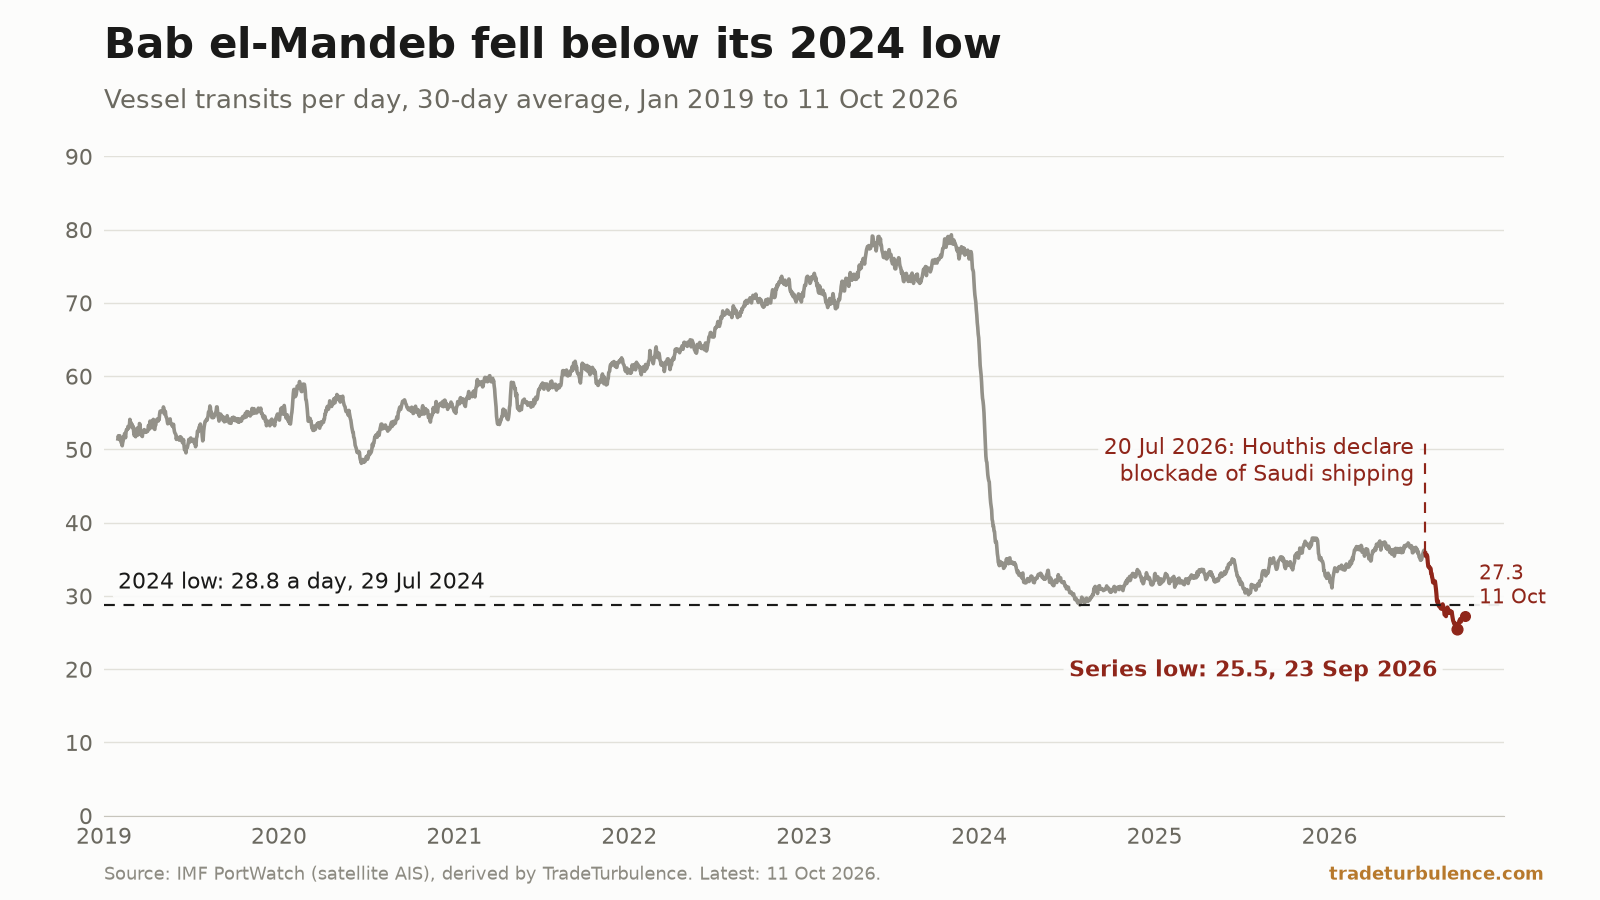
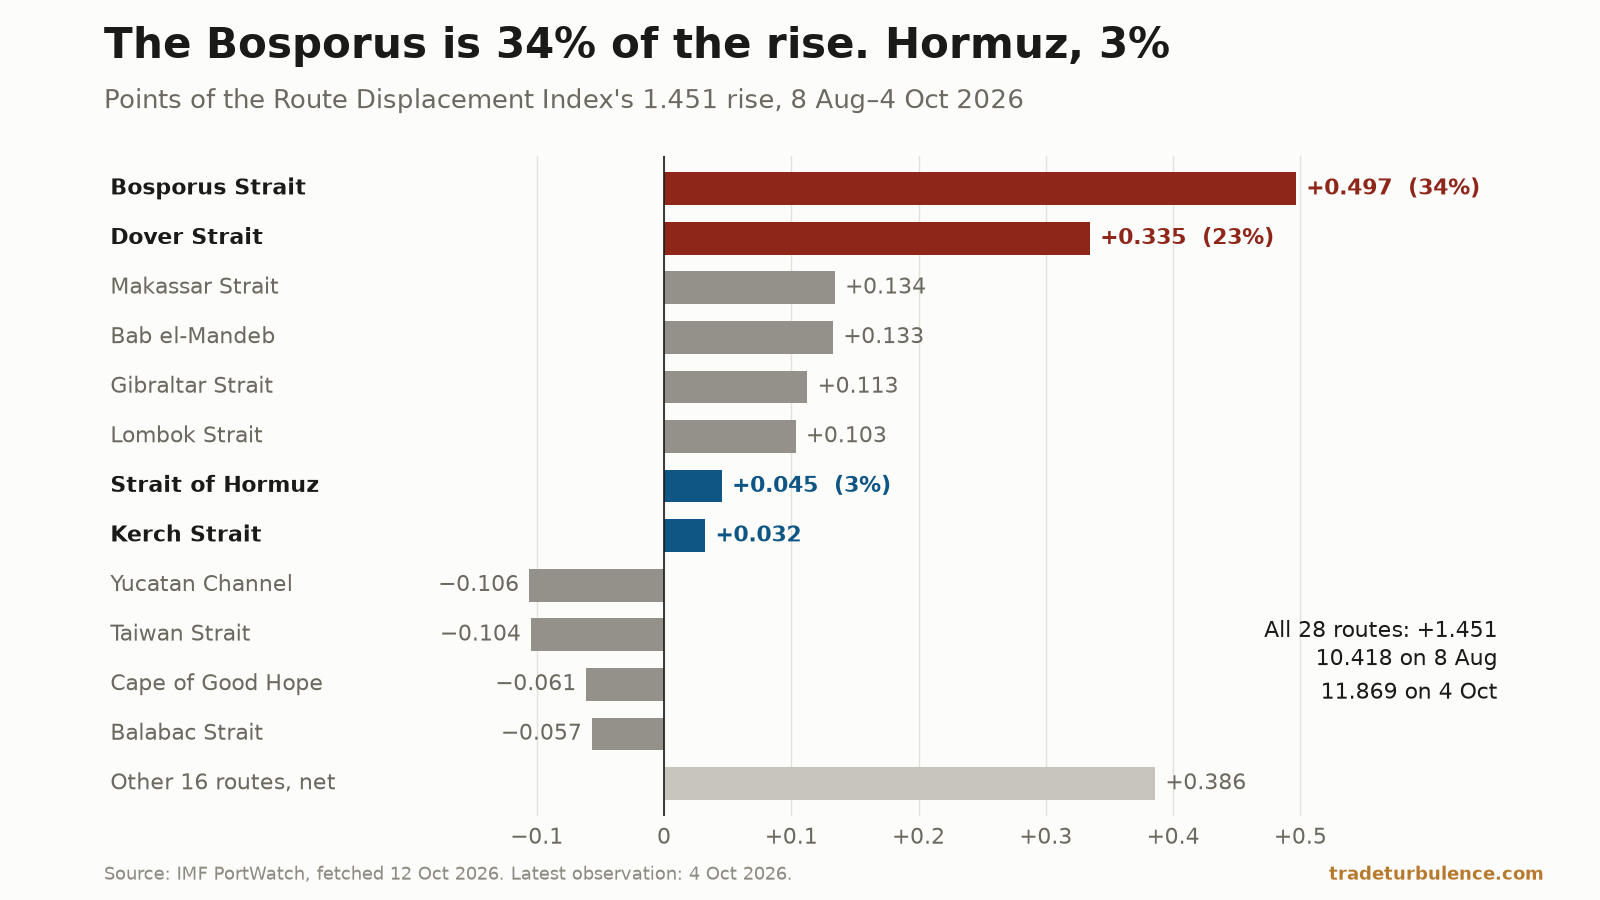
The site’s 12 October piece found that the Bosporus accounted for 34% of the index’s rise from 8 August to 4 October, the Dover Strait for 23% and Hormuz for 3%. The 16 October piece found that Bab el-Mandeb averaged 25.5 transits a day in the 30 days to 23 September, the lowest in PortWatch’s series from 2019, and that this time the Cape lost ships, from 91.5 a day in the first half of 2026 to 86.6 in those 30 days, where in 2024 it had gained them. Routes have their own topic, Shipping and chokepoints, which lists the site’s pieces on them. This guide keeps to how they bear on the wider chain.
China supplies 7.8% of US goods imports, the least since 1998, and Taiwan nearly as much
In the 12 months to August 2026, China supplied 7.77% of US goods imports, on the Census Bureau’s figures by country, with both the country and the world totals not seasonally adjusted. No 12-month period since the one to October 1998 was as low. The peak was 21.8%, in the 12 months to March 2018. The 13 August piece found 7.95% for the 12 months to June 2026. Two months of data later, the share is lower, at 7.77%. That piece divided by the seasonally adjusted world total, on which the peak falls in the 12 months to February 2016, at the same 21.8%.
China is the third-largest supplier, behind Mexico and Canada:
| From | 12 months to August 2026 | Share | 12 months to August 2025 |
|---|---|---|---|
| Mexico | $599.2bn | 17.07% | $524.8bn |
| Canada | $392.8bn | 11.19% | $397.0bn |
| China | $272.8bn | 7.77% | $380.4bn |
| Taiwan | $269.1bn | 7.67% | $159.8bn |
| Vietnam | $247.2bn | 7.04% | $173.4bn |
| All countries | $3,510.0bn | 100% | $3,453.3bn |
Mexico’s, Taiwan’s and Vietnam’s shares are each the highest of any 12-month period in the file, which runs from 1987, and from 1995 for Vietnam. Taiwan’s 12-month total rose $109.3bn, or 68.4%, in a year, and is $3.7bn short of China’s. Taiwan shipped more than China in six single months in a row, December 2025 to May 2026; China led again in June, July and August. Total US goods imports rose 1.6% over the year.
Since China’s peak its share has fallen 13.99 points. Taiwan gained 5.86, Vietnam 5.05 and Mexico 3.72: together, slightly more than China lost. After China, Japan, Canada and Germany lost the most share.
Two July pieces measured other sides of the same shift. One found that between the years to September 2022 and May 2026 China’s share fell from 17.4% to 7.8% while total US goods imports rose 4.8%. Over the same span, in 12-month import dollars, Mexico gained $117.1bn while China lost $298.8bn, so Mexico absorbed 39% of China’s decline. The other found that the BLS import price index for goods from China, which excludes duties, rose 2.1% in dollars from July 2025 to June 2026 and fell 3.6% in yuan. The site’s tariff pages give the tariff the United States actually charges on each partner’s goods, as duty per dollar of imports, month by month since 2017. The policy side is followed in US-China trade and Tariffs and trade policy.
US chip output set a record in September 2026. Producer prices for semiconductors and related devices set record lows in July and August
US output of semiconductors and other electronic components in the Federal Reserve’s industrial production index, which the site follows on its chip output page, reached 198.63 in September 2026 (2017 = 100), the highest of the 657 months since January 1972. Every month from April to September set a new high. Output was 19.9% above September 2025. Capacity utilisation in the industry was 76.5% in September. It was lower in 214 of the 657 months, and was 92.2% in February 2022.
Which way prices went depends on the index. The Bureau of Labor Statistics' producer price index for semiconductors and related devices fell in each of the four months from May to August 2026, to 28.541, the lowest of the 716 monthly readings since January 1967. July’s 29.067 had been below every month before it. September rose 0.9%, to 28.801, 2.2% below September 2025. The BLS index for the whole industry the output figure covers, semiconductors and other electronic components, which the site follows on its chip prices page, went the other way: up 26.0% in the year to September 2026.
Two pieces of 27 July read the output index and the narrower price index. The piece on chip output found a record June reading of 181.9. The Fed has since revised June to 188.26, and each month from July to September passed it. The piece on chip prices found that over the three months to June output rose 4.8% while prices fell 1.5%. On the narrower price index that pattern held over the year to September; on the wider one it did not.
Start here
- 16 October 2026. Bab el-Mandeb fell below its 2024 low. Suez did not: Bab el-Mandeb averaged 25.5 transits a day in the 30 days to 23 September, the lowest in PortWatch’s series from 2019; tankers were 61% of the fall, and the Suez Canal held.
- 12 October 2026. The Bosporus is 34% of the rise in route displacement: the Route Displacement Index read 11.87% on 4 October, the highest of 2,805 daily readings since January 2019, and the Bosporus and the Dover Strait supplied 57% of its rise since 8 August.
- 13 August 2026. China’s share of US imports is back to its 2000 level: China supplied 7.95% of US goods imports in the 12 months to June 2026, and Mexico’s 16.7% was the highest in the 36 years the series could be compared.
- 30 July 2026. The China discount reversed in dollars. In yuan it never did: the pre-duty price index of Chinese goods rose 2.1% in dollars from July 2025 to June 2026, and fell 3.6% translated into yuan.
- 29 July 2026. US imports didn’t fall under tariffs. They changed address: China’s share fell from 17.4% to 7.8% between the years to September 2022 and May 2026 while total US goods imports rose 4.8%, and Mexico’s $117.1bn rise in 12-month import dollars was 39% of China’s $298.8bn fall.
- 27 July 2026. Chip output rose 4.8% last quarter. Chip prices fell 1.5%: over the three months to June, US semiconductor output rose 4.8% and producer prices fell 1.5%, and over three years output rose 34.3% while prices fell 6.0%.
What the data cannot show
The pressure index is a composite, not a cost. It is measured in standard deviations from its own average, its survey inputs come from seven economies, and its latest months can be revised as reported data replace estimated inputs. It cannot say which link in a chain is under strain, or why.
The Stress Index ranks; it does not count. A pillar score of 99.2 says that one month of 2010–2019 read higher. The index’s specification says it measures “friction in moving and paying for goods, not the volume traded”, and that it “is not a forecast”.
A transit count is a floor. PortWatch counts ships by their AIS transponders, and the Stress Index methodology says: “A vessel with its transponder off is not counted.” PortWatch also revises its history: the 12 October piece found that the 8 August reading of the Route Displacement Index, printed in August as 10.29, was 10.42 in the counts fetched on 12 October.
An import share credits the whole value of a good to one country. Census assigns each import to its country of origin, “the country where the merchandise was grown, mined, or manufactured, in accordance with U.S. Customs Regulations”, and to the country of shipment when the origin cannot be determined (Census guide). A share cannot show where the parts inside a good were made. It is in current dollars, so it moves with prices as well as quantities, and Census revises the monthly figures each June.
The two chip price indexes cover different industries. Output covers semiconductors and other electronic components; the narrower price index covers semiconductors and related devices only, as the 27 July piece on chip prices noted. The wider index matches the output’s industry, but on its own it does not show which of the industry’s products got dearer. Both price indexes are preliminary for June to September 2026 and can be revised for four months, so the two record lows may move. BLS adjusts the microcircuit indexes for quality, so, as that piece explained, a falling index is not the same as a smaller invoice.
None of these series names a cause. They show when and how much. They do not say whether a change came from tariffs, demand, war or anything else.
Where to follow it
The Stress Index, pillar by pillar. The five pillars on the index page give the Supply chains and Shipping routes scores each day, with the date of every input: the monthly pressure index and PortWatch’s daily counts. The daily history from January 2008 is in ttsi.csv.
Every route. The chokepoint board lists all 28 chokepoints against their 2019–2023 baselines, with the Route Displacement Index and the count of half-closed routes; two years of daily readings are in rdi.csv.
What importers pay. The US effective tariff rate divides the customs duties deposited at the Treasury over 91 days by the goods imported over the same days. It read 7.75% on 15 October 2026.
Chips. The AI and compute data pages carry the output series and the wider price index named above, monthly, each with its publisher and series code.
The economies at each end. The China page carries US goods trade with China over 12 months and cargo through Chinese ports; the United States page carries cargo through US ports beside the main US figures.
Sources for this guide
- 1 Economic Policy Uncertainty Index: Categorical Index: Trade policy (EPUTRADE) · Baker, Bloom & Davis via FRED
- 2 Global Supply Chain Pressure Index (GSCPI), monthly data · Federal Reserve Bank of New York
- 3 The GSCPI: A New Barometer of Global Supply Chain Pressures, Staff Report No. 1017 (May 2022) · Federal Reserve Bank of New York
- 4 U.S. Trade in Goods by Country (country.xlsx: imports by country, not seasonally adjusted) · US Census Bureau
- 5 Guide to Foreign Trade Statistics, Section 2 (import country of origin) · US Census Bureau
- 6 Industrial Production: Semiconductor and Other Electronic Component (IPG3344S) · Board of Governors of the Federal Reserve System via FRED
- 7 Capacity Utilization: Semiconductor and Other Electronic Component (CAPUTLG3344S) · Board of Governors of the Federal Reserve System via FRED
- 8 PPI by Industry: Semiconductor and Related Device Manufacturing (PCU334413334413) · US Bureau of Labor Statistics via FRED
- 9 PPI by Industry: Semiconductor and Other Electronic Component Manufacturing (PCU33443344) · US Bureau of Labor Statistics via FRED
- 10 Daily chokepoint transit data · IMF PortWatch
- 11 TradeTurbulence Stress Index (v3) and methodology · TradeTurbulence
- 12 Chokepoint board and Route Displacement Index · TradeTurbulence
- 13 US effective tariff rate · TradeTurbulence
Every piece on this topic
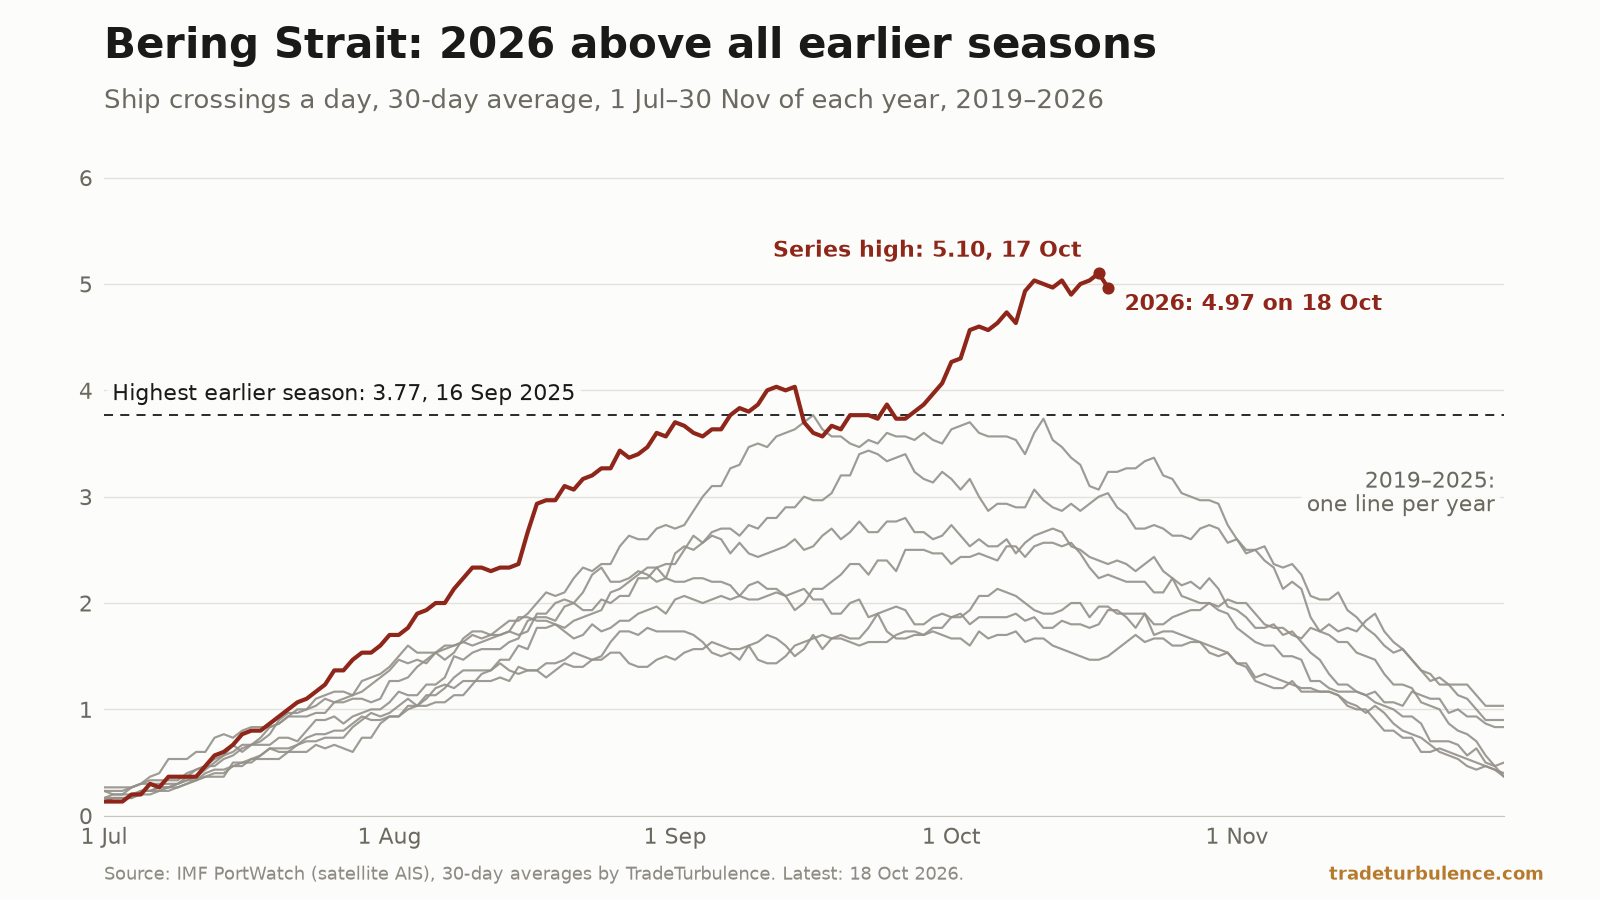
- In 18 days, the Bering Strait beat every earlier OctoberGeopolitics & trade
Ships crossed the Bering Strait 95 times on 1–18 October 2026, more than in any full October in PortWatch's count since 2019. The busiest, in 2025, had 88.
- Bab el-Mandeb fell below its 2024 low. Suez did not.Geopolitics & trade
Bab el-Mandeb's 30-day traffic hit 25.5 transits a day on 23 September, the lowest in PortWatch's series from 2019. Tankers were 61% of the fall. Suez held.
- A Stress Index of 80 is higher than any day of 2010–2019Explainers
Severe starts at 80. No weekday of 2010–2019 reached it. As built at 02:16 UTC on 13 October 2026, 68 weekdays of 2026 had; version 3 read 82.3 for 9 October.
- The Bosporus is 34% of the rise in route displacement. Hormuz, 3%Geopolitics & trade
On counts fetched 12 October, the Route Displacement Index rose from 10.42% on 8 August to 11.87% on 4 October. The Bosporus and Dover supplied 57%; Hormuz, 3%.
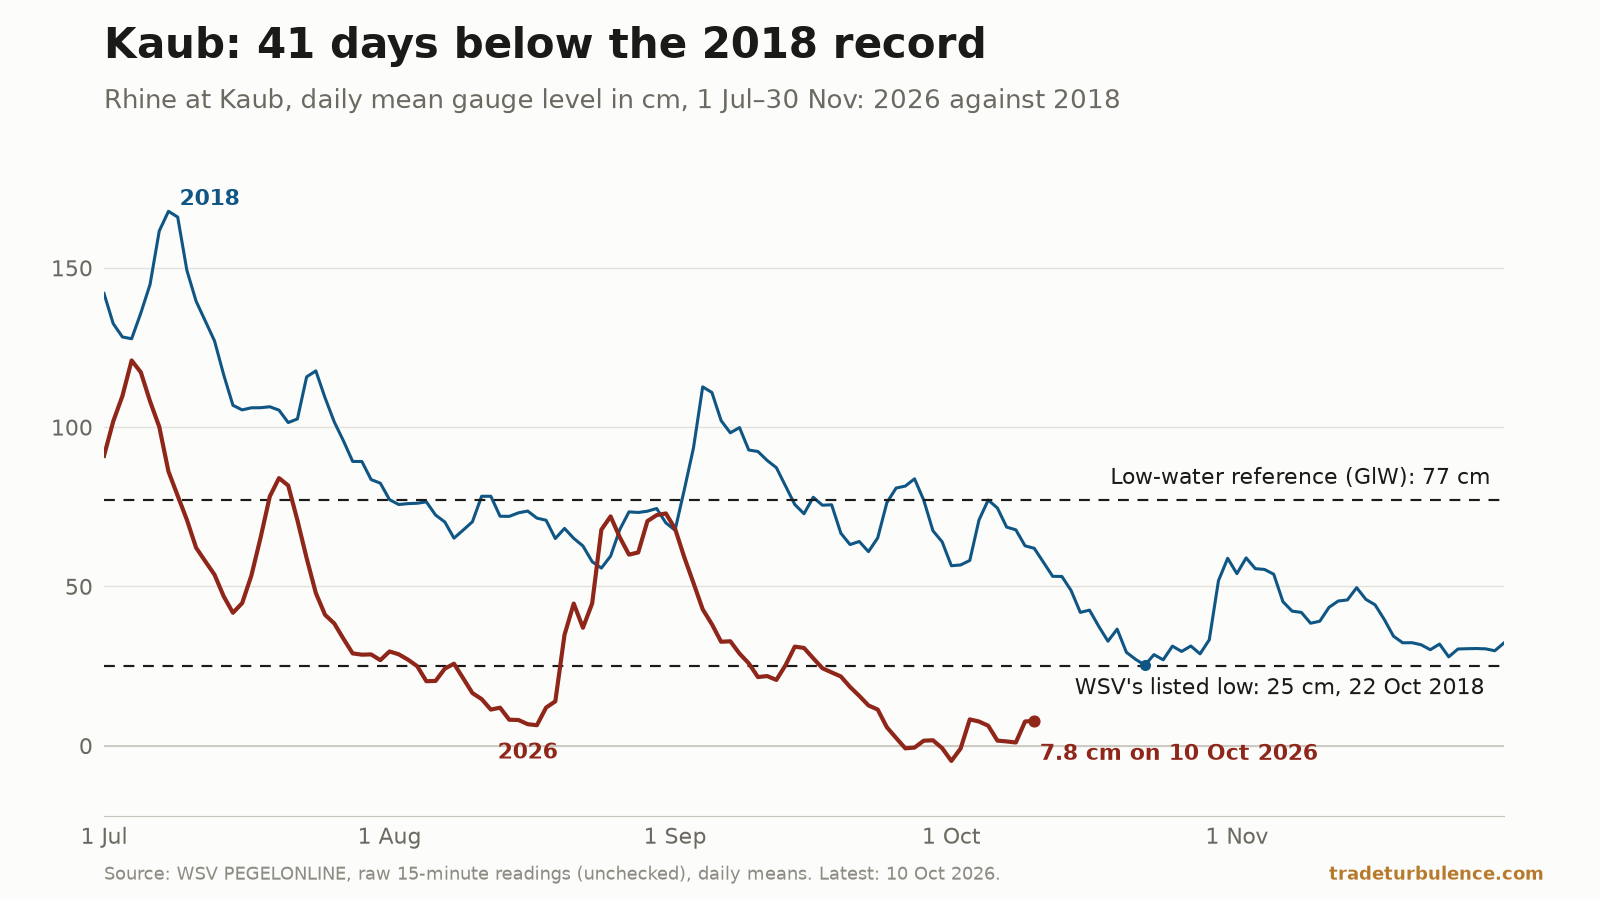
- The Rhine at Kaub has spent 41 days below its 2018 recordGeopolitics & trade
The Kaub gauge averaged 7.8 cm on 10 October, its 41st day of 2026 below the 25 cm low of 2018. From 2000 to 2025, no day in the agency's data was under it.
- Kerch now moves in a month what it once moved in a dayGeopolitics & trade
In the 30 days after Russia's 10 July suspension notice took effect, 34 vessels passed the Kerch Strait. Its 2019–23 baseline moved 37.4 in an average day.
- China's share of US imports is back to its 2000 level.Geopolitics & trade
China supplied 7.95% of US goods imports in the year to June 2026, back to its June 2000 level and down from a 21.8% peak. Mexico is at a record 16.7%.
- A tenth of chokepoint traffic is on a different route.Geopolitics & trade
The Route Displacement Index reached 10.29% on 8 August, the highest of 2,749 daily readings since 2019. Total chokepoint transits ran 6.1% under baseline.
- Malacca peaked in January. The Red Sea never moved it.Geopolitics & trade
Malacca's busiest month on record was January 2026. It sits 23% above a baseline that contains the pandemic, and 3.5% below its own trailing 12 months.
- The Kerch Strait broke 107 days before the invasionGeopolitics & trade
Kerch Strait transits fell to 3.1 a day in July 2026, in what is normally its busiest season. The daily series broke on 9 November 2021, not in February 2022.
- The Strait of Hormuz hit zero three times. It is still at 18%.Geopolitics & trade
Transits through the Strait of Hormuz fell from 152 on 22 February to zero on 13 March. July ran at 16.5 a day against an 89.7 baseline — 18% of normal.
- The China discount reversed in dollars. In yuan it never did.Geopolitics & trade
The pre-duty price of Chinese goods has risen 2.1% in dollars since July 2025. Translated back into yuan, the same series fell 3.6% over the same months.
- Saudi Arabia entered the war. The index cannot see it yet.Geopolitics & trade
US and Saudi forces struck Iran-backed militias in Iraq on 29 July. Every series in the Stress Index predates it — the oldest by 89 days. What that hides.
- US imports didn't fall under tariffs. They changed address.Geopolitics & trade
China's share of US goods imports fell from 17.4% to 7.8% since 2022. Total imports rose 4.8% over the same period. Mexico took only 39% of the difference.
- The stress index reads Normal. Nothing inside it does.Macroeconomics & policy
The TradeTurbulence Stress Index sits at 49.0 — energy 86.7, trade activity 10.4. Three months in 221 have carried that signature. They ended differently.
- Ukraine hit Iran-bound ships in the Caspian. Oil is up 22%.Geopolitics & trade
Ukraine's Caspian strikes fused two wars into one supply line. Brent has round-tripped from $71 to $138 to $68, and the price data stops before the attack.
- Chip output rose 4.8% last quarter. Chip prices fell 1.5%.Technology
Semiconductor prices fall while every other manufactured good gets dearer. The 12-month gap is ten points — and the quarterly decline is really two months.
- A record June for chip output — but not a seven-month climbTechnology
US semiconductor output hit an all-time high of 181.9 in June. Output fell in two of the seven months that got it there, and capacity is growing faster still.
- You cannot audit OpenAI's losses. You can audit the electricity bill.Technology
The AI build-out's costs are hidden inside private companies. But US tech capex is back near its dot-com share, electricity generation has broken a 14-year flatline, …
- The US trade deficit widened $23bn in a month. The level isn't the story.Geopolitics & trade
May's $23bn one-month widening was the third largest since 1992 and is not seasonal. But the deficit is trending better, not worse — and monthly swings this size …