Topic
Shipping and Chokepoints
Where ships can and cannot pass: daily transits through the maritime chokepoints, each counted against its own baseline, the share of traffic pushed onto a different route, and the rivers that barges depend on.
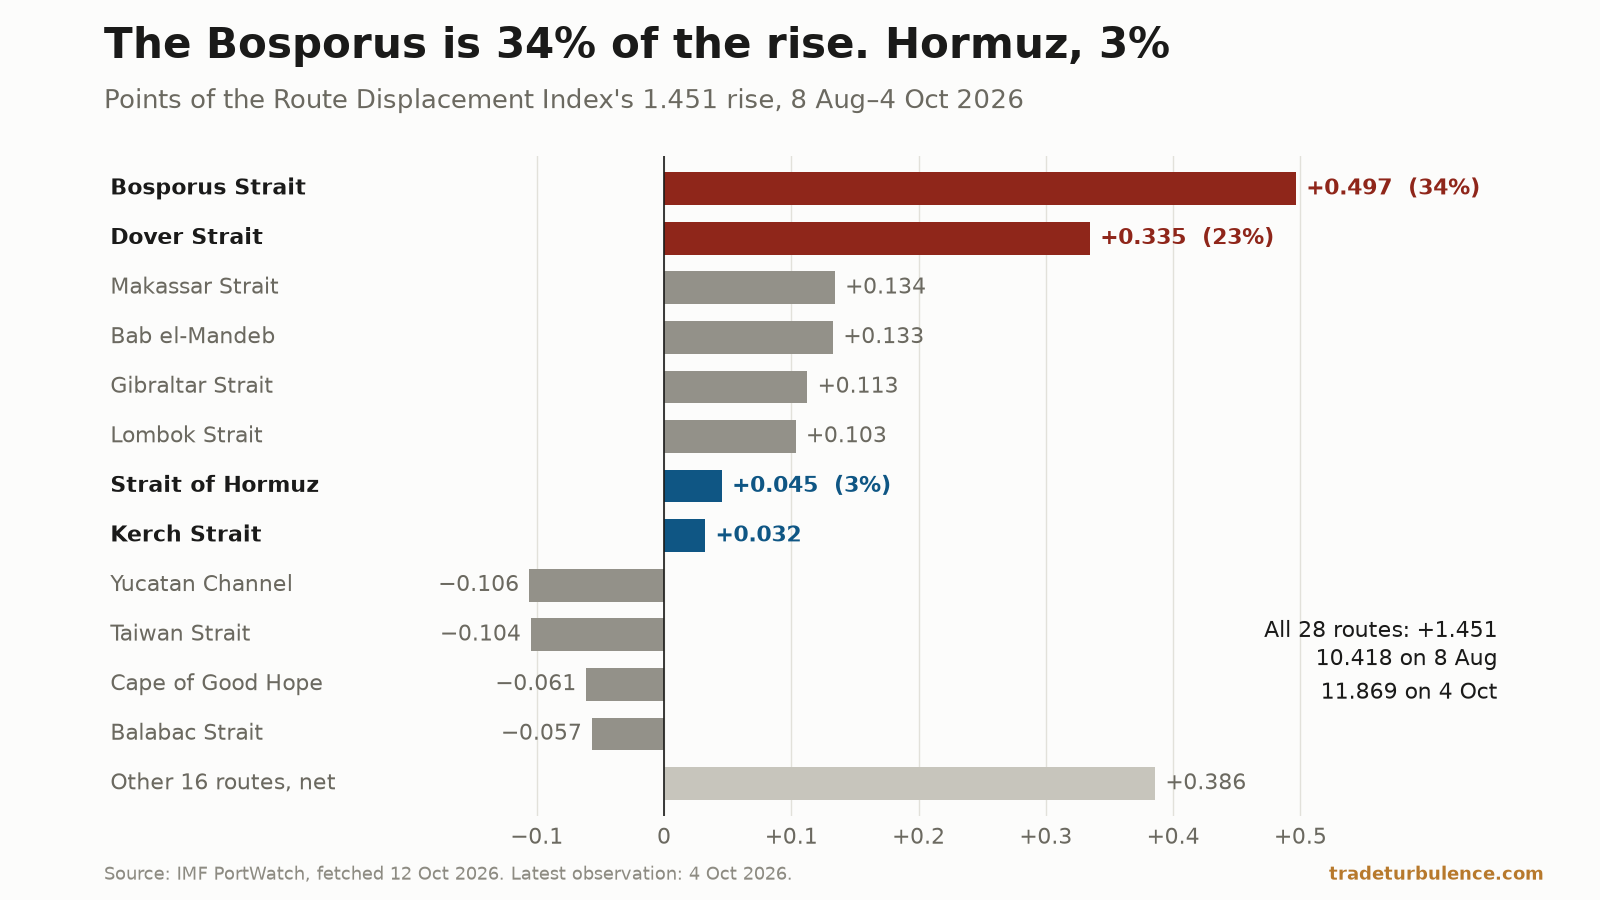
- The Bosporus is 34% of the rise in route displacement. Hormuz, 3%Geopolitics & trade
On counts fetched 12 October, the Route Displacement Index rose from 10.42% on 8 August to 11.87% on 4 October. The Bosporus and Dover supplied 57%; Hormuz, 3%.
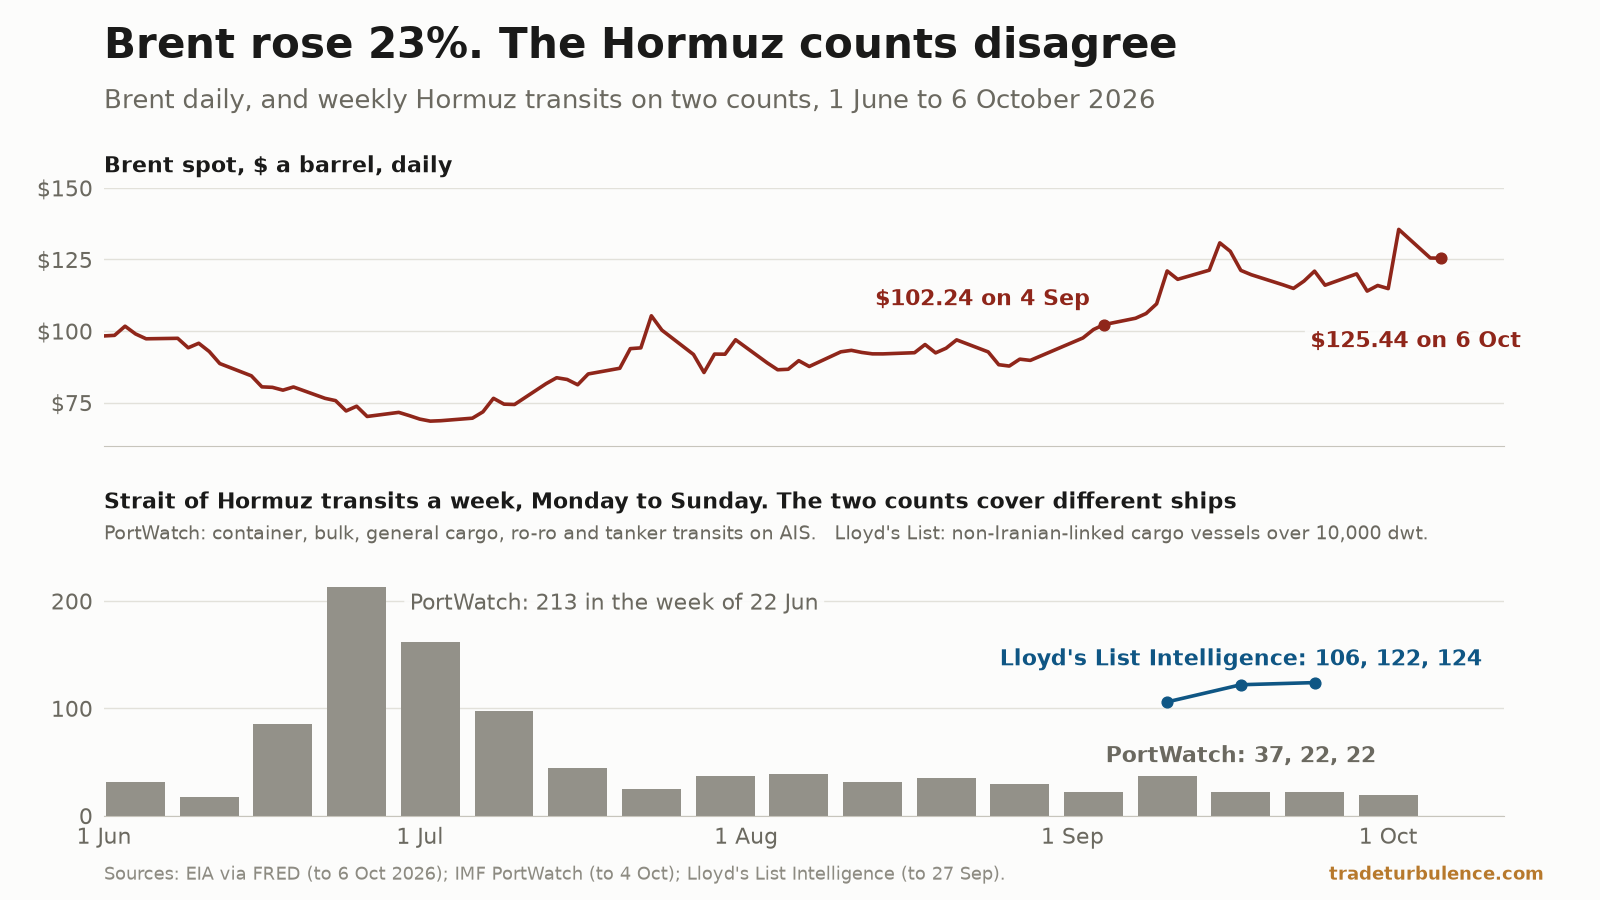
- Brent rose 23% in a month. The Hormuz counts point both waysMarkets
Brent rose 22.7% from 4 September to 6 October. PortWatch has 109 Hormuz transits in September; Lloyd's List, counting a different set of ships, at least 477.
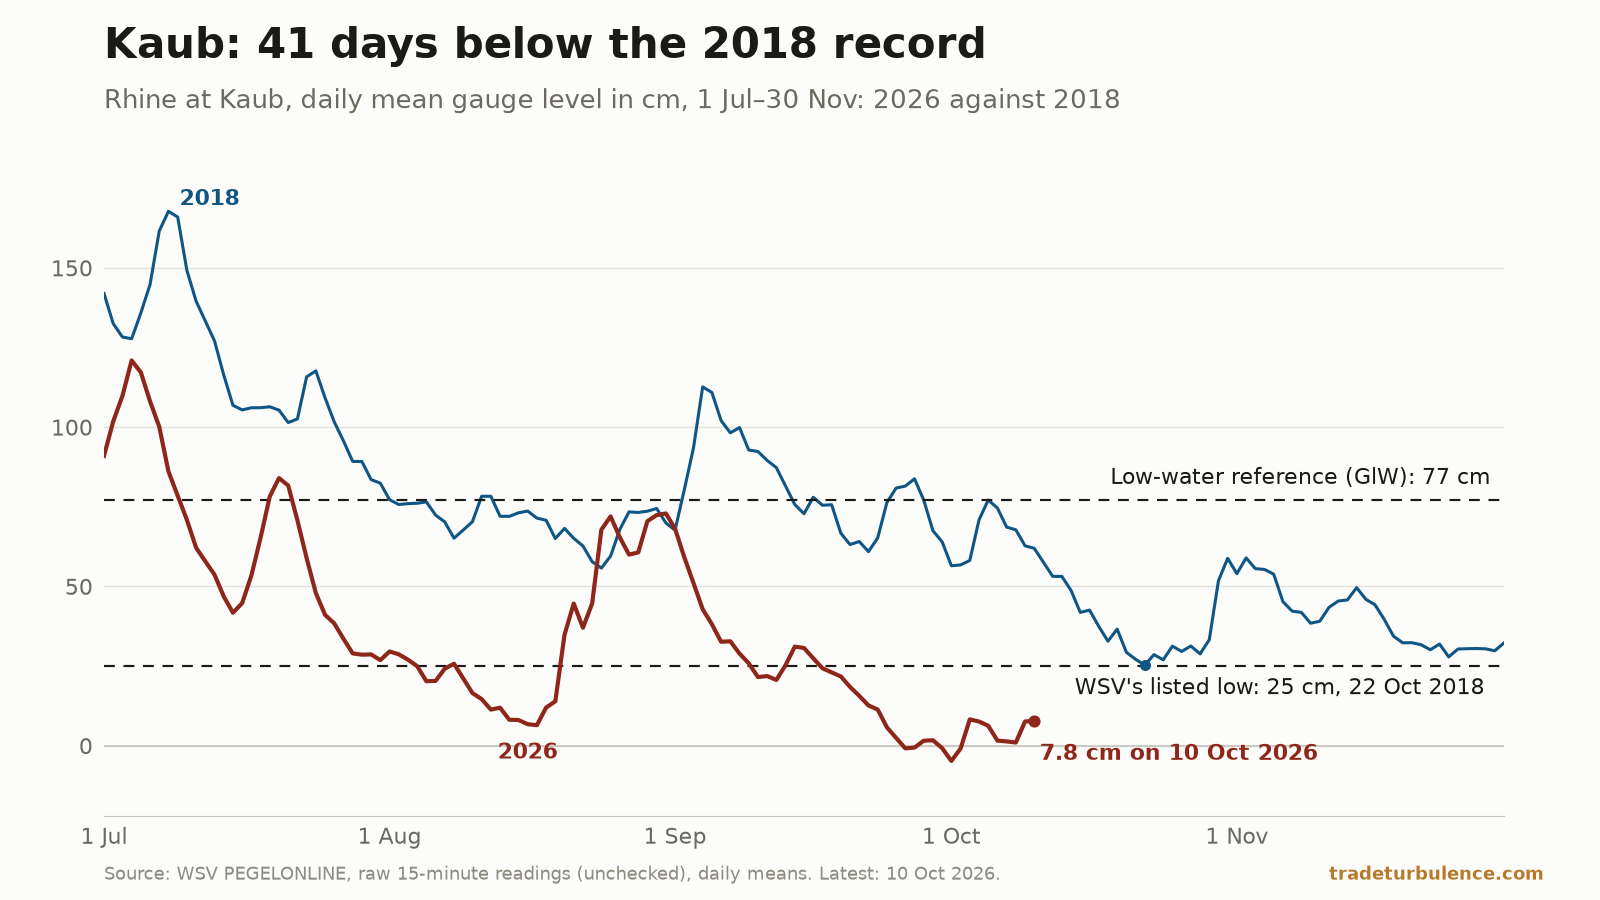
- The Rhine at Kaub has spent 41 days below its 2018 recordGeopolitics & trade
The Kaub gauge averaged 7.8 cm on 10 October, its 41st day of 2026 below the 25 cm low of 2018. From 2000 to 2025, no day in the agency's data was under it.
- Kerch now moves in a month what it once moved in a dayGeopolitics & trade
In the 30 days after Russia's 10 July suspension notice took effect, 34 vessels passed the Kerch Strait. Its 2019–23 baseline moved 37.4 in an average day.
- A tenth of chokepoint traffic is on a different route.Geopolitics & trade
The Route Displacement Index reached 10.29% on 8 August, the highest of 2,749 daily readings since 2019. Total chokepoint transits ran 6.1% under baseline.
- Malacca peaked in January. The Red Sea never moved it.Geopolitics & trade
Malacca's busiest month on record was January 2026. It sits 23% above a baseline that contains the pandemic, and 3.5% below its own trailing 12 months.
- The Kerch Strait broke 107 days before the invasionGeopolitics & trade
Kerch Strait transits fell to 3.1 a day in July 2026, in what is normally its busiest season. The daily series broke on 9 November 2021, not in February 2022.