Topic
Oil markets
Crude and refined product pricing, output decisions and the distance between a headline shock and a sustained change in the forward curve.
Data for this topic
The guide to Oil markets
Figures as of 16 October 2026. Updated 19 October 2026. AI-assisted, reviewed by Hritik.
This site reads the oil market through one price: Brent crude, in dollars a barrel. On 14 October 2026 it was $126.55. Of the other 9,107 daily prices since the series began in May 1987, only 67 were higher, and 41 of those fell in 2008. Adjusted for US inflation, the price was 42.7% below the series’ real peak, in July 2008. What set 2026 apart was the swings. From 1 January to 14 October 2026, Brent moved 5% or more in a day 39 times. Only one calendar year since the series began had more: 2020, with 41.
On 14 October 2026, Brent was dearer than on all but 67 days since 1987
The price is the EIA’s daily Brent spot price, as FRED distributes it. The series starts on 20 May 1987 and is published days after the market: on 18 October 2026 its newest print was the $126.55 of 14 October.
The 67 dearer days are clustered. Forty-one fell between 21 May and 23 July 2008, two in 2011 and six in 2012, and nine between 7 March and 14 June 2022. Nine were in 2026: 31 March, 2 and 7 April, 15 and 16 September, and 2, 8, 9 and 12 October. Against its own past five years, the 14 October price was at the 98.57th percentile, as the site’s Brent page ranks each print: 18 of the previous 1,260 trading days were dearer.
It was not a record. The series’ nominal high, to 14 October 2026, was $143.95, on 3 July 2008, and 14 October’s price was 12.1% below it. Across the 199 prints from 2 January to 14 October 2026, the range ran from $61.08 on 7 January to $138.21 on 7 April. The average from 1 January to 14 October 2026 was $94.85, against $69.14 for 2025. In the 12 months to 14 October 2026 the price rose 100.9%, from $63.00 on 14 October 2025.
Adjusted for inflation, Brent on 14 October 2026 was 42.7% below July 2008, the series’ real peak from May 1987
The site’s Stress Index (version 3) deflates Brent by the US consumer price index, putting each day’s price in the dollars of the latest CPI month (methodology). The figures here use September 2026, the latest month published by 18 October 2026. On that basis the 3 July 2008 price was $221.03, and 14 October’s $126.55 was 42.7% below it. In real terms, 1,368 of the other 9,107 days since 1987 were dearer, including 248 in 2011, 249 in 2012 and 252 in 2013. Across 2011–2013 the real price averaged $162.12.
That is why the index scores the level as ordinary. It ranks the real price against its value on every day of 2010–2019, also in September 2026 dollars. The 14 October price scored 59.4: 1,027 of the decade’s 2,529 daily prices were dearer, and 1,502 cheaper. The decade’s real peak was $189.97, on 28 April 2011.
Brent moved 5% or more in a day 39 times in 2026 to 14 October. In the series from May 1987, only 2020 had more
Of 199 day-to-day changes in 2026 to 14 October, 39 were 5% or larger, up or down. The five years 2021–2025 had 42 between them, out of 1,263 changes. Only one calendar year in the series, which starts in May 1987, had more than 2026’s 39 to 14 October: 2020, with 41.
The largest rise of 2026 to 14 October came on 2 October, from $114.82 to $135.51: $20.69, or 18.0%. To 14 October 2026, no one-day rise in the series since May 1987 was larger in dollars; the next was $11.47, on 10 September 2026. By percentage, which allows for the price level, seven were larger, four of them in April and May 2020. The next print, on 5 October, took $10.00 back.
The Stress Index captures these swings as Brent’s 20-day realised volatility: how widely the past 20 daily changes were spread, scaled to a year. In the 20 trading days to 14 October 2026 it was 76.7%. That is higher than any 20-day stretch of 2010–2019: the decade’s highest was 72.0%, in the 20 days to 17 February 2016. It is not a record: of the other 9,087 days since June 1987, when the measure begins, it was higher on 337, 64 of them in 2026 and 59 in 2020; its peak in that span was 339.8%, in the 20 days to 24 April 2020. From 1 January to 14 October 2026 it peaked at 109.6%, in the 20 days to 17 April.
The index’s Energy costs pillar averages the two scores, volatility and the real price. On 15 October 2026, scoring prices observed on 14 October, it read 79.7, in the Elevated band just under the Severe floor of 80. Volatility scored 100, beyond anything in its reference decade, and the real price 59.4. The headline index (v3) read 81.4 on 15 October 2026, Severe, higher than every day of 2010–2019, with three of the other four pillars Severe. In the index’s history from 2008, which before 2020 is a reconstruction, the energy pillar had read 79.7 or more on 181 other days: 98 in 2008, 55 in 2011, 17 in 2022 and 11 in 2026.
By the EIA’s estimate, Hormuz oil flows fell from 21.6 million barrels a day in October–December 2025 to 4.9 million in April–June 2026
The Strait of Hormuz connects the Persian Gulf with the Gulf of Oman and the Arabian Sea. The US Energy Information Administration estimated in June 2025 that oil flows through it averaged 20 million barrels a day in 2024, about 20% of global petroleum liquids consumption. Flows in 2024 and the first quarter of 2025 were more than a quarter of global seaborne oil trade.
The EIA’s August 2026 Short-Term Energy Outlook put crude oil and petroleum liquids through the strait at 4.9 million barrels a day in the second quarter of 2026, down from 21.6 million in the last quarter of 2025, before the conflict began. That is 22.7% of the earlier rate. As of the October outlook, released on 6 October 2026, it was the EIA’s latest estimate in barrels a day: neither that outlook nor September’s gives a later one. For September the October outlook gives a direction instead, set out below.
The EIA also estimates how much crude production the closure has shut in at seven Gulf producers. Its October 2026 outlook put that at 4.8 million barrels a day in September 2026, down from 5.8 million in August and 10.9 million at the peak in May. The seven produced 25.2 million barrels a day in February 2026, so September’s shut-in was 18.9% of that. The estimates are revised: the September outlook had put August at 6.7 million.
For the price, the EIA gives its own account. Brent averaged $114 in September 2026, $23 above August, and the agency says prices “rose following increased attacks on oil infrastructure and tankers around the Middle East”, most notably on Saudi Arabia’s East-West pipeline, “a crucial bypass used to circumvent the Strait of Hormuz”.
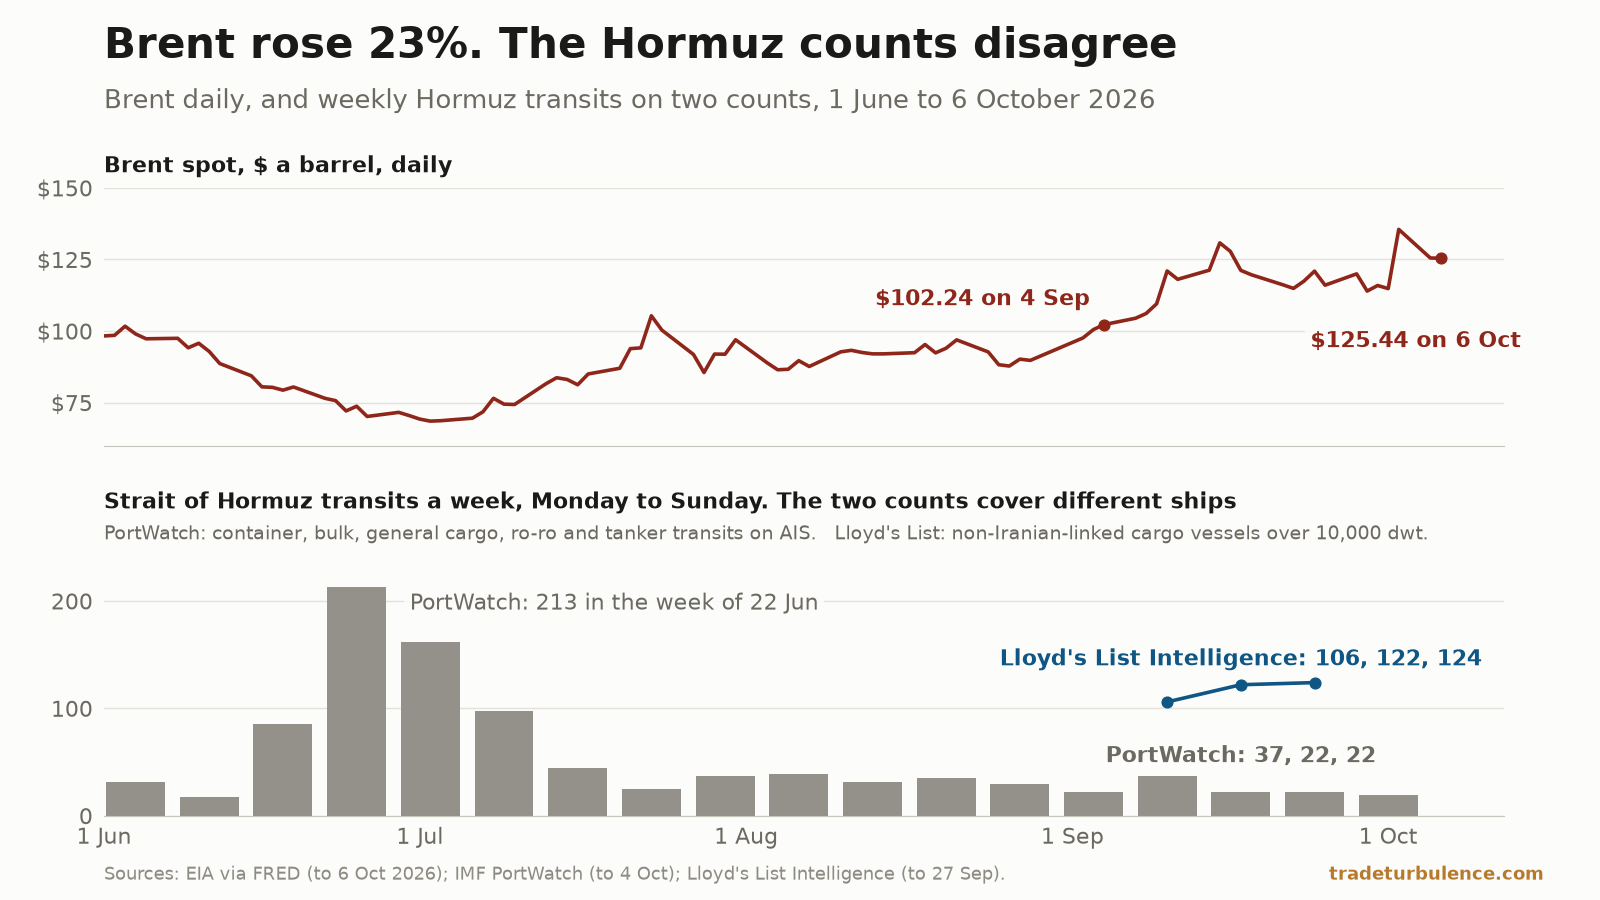
IMF PortWatch counts ships, not barrels. Its daily total adds up the container ships, dry bulk carriers, general cargo ships, ro-ro vessels and tankers whose AIS signals cross the strait. In the 30 days to 11 October 2026 it recorded 102 transits, 3.4 a day, against its average of 82.1 a day from January 2019 to October 2023: 95.9% below. February 2026 had averaged 78.3 a day. Of the other 2,811 days since 30 January 2019 with a 30-day average, only 10 had a lower one, 30 March to 8 April 2026; the lowest in that span was 2.63, in the 30 days to 31 March 2026. As a calendar month, September 2026 had 109 transits, 3.6 a day. Of the 92 other full months since January 2019, only March 2026 had a lower daily average.
For September, the two sources point different ways. PortWatch’s count fell from 146 transits in August 2026 to 109 in September. In the same October 2026 outlook, the EIA says: “Ship tracking data from Vortexa indicates that oil shipments through the Strait of Hormuz increased slightly in September as Saudi Arabia increasingly used ship-to-ship transfers along Oman’s coast”. They do not measure the same thing. PortWatch counts ships of every cargo type crossing the strait, whatever they carry; the EIA reports oil shipments from Vortexa’s data, as a direction with no figure. Neither settles which way the oil moving through the strait went in September.
In rupees, a barrel reached ₹13,051 on 2 October 2026, the highest in the series from May 1987 to 14 October
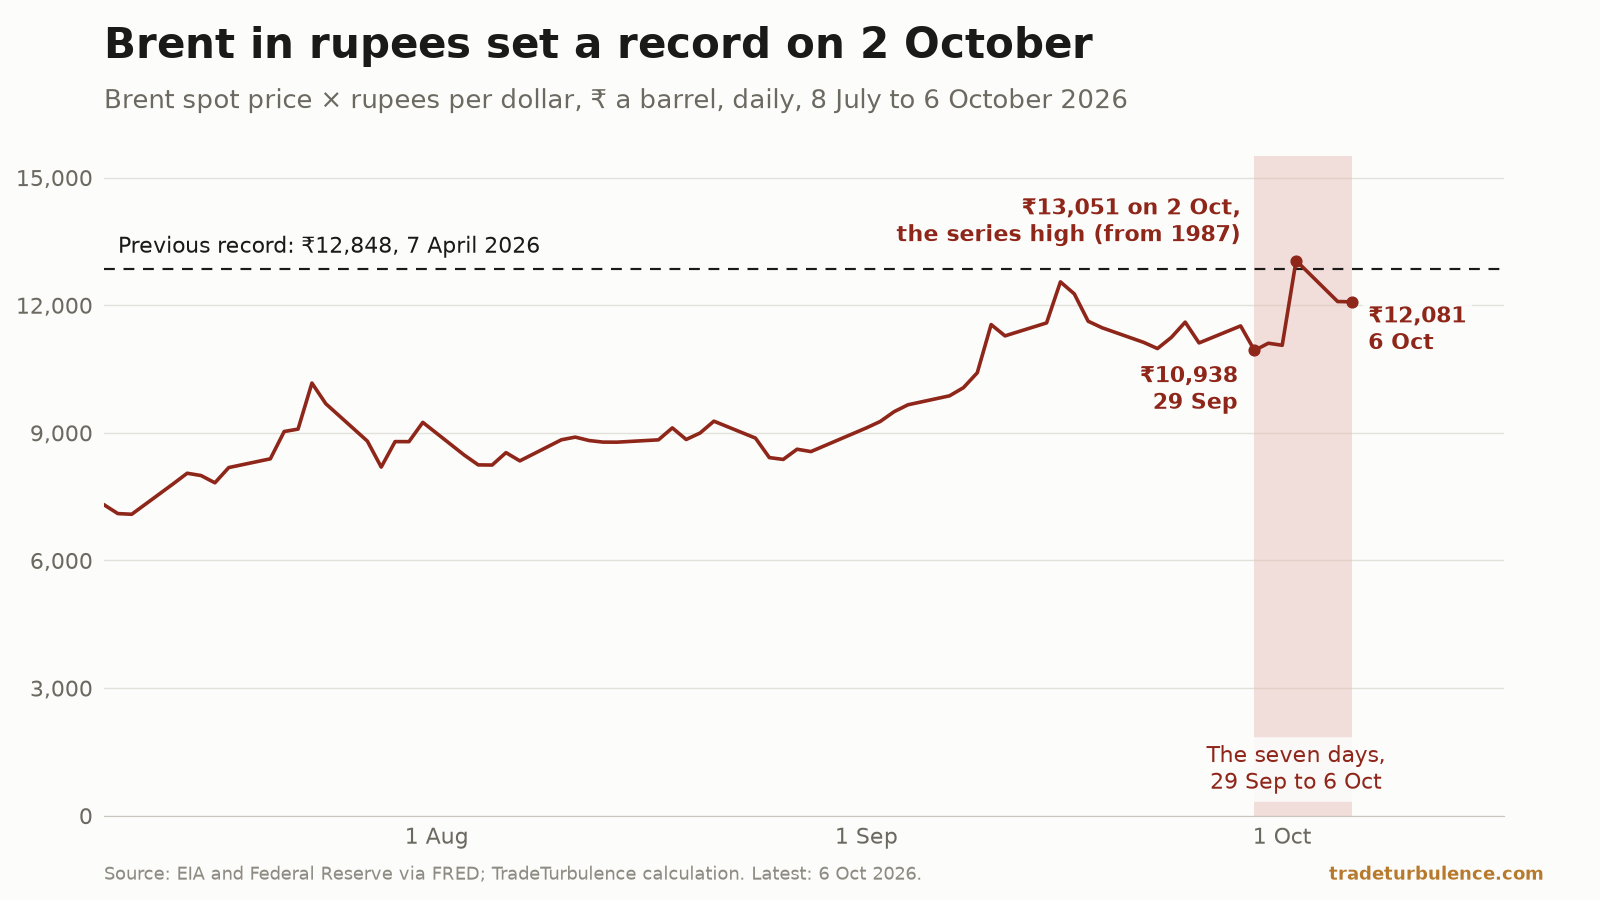
For India, the site publishes Brent in rupees: the EIA’s dollar price multiplied by the Federal Reserve’s daily rupee rate, or by the ECB’s on days after the Fed’s latest. On 2 October 2026 a barrel came to ₹13,051, $135.51 at 96.31 rupees to the dollar: the highest in the series from May 1987 to 14 October 2026. It passed the ₹12,848 of 7 April 2026 by 1.6%. In dollars the order is reversed: 7 April’s $138.21 was the highest print of 2026 to 14 October. The exchange rate made the difference: 92.96 rupees to the dollar on 7 April, 96.31 on 2 October.
Before 2026, the series high was ₹10,264, on 8 March 2022. On 14 October, at 95.16 rupees to the dollar crossed from the ECB’s euro reference rates, the price was ₹12,042, 7.7% below the record. Over the 12 months to 14 October 2026 it rose 115.3%, while the dollar price rose 100.9%.
The Fed’s series had the rupee at 96.73 to the dollar on 9 October 2026, 0.09 short of its weakest, 96.82 on 20 May 2026, in a series that starts in January 1973. Crossed through the euro, the ECB’s reference rates also gave 96.73 for 9 October, and 94.96 for 16 October 2026.
Whether oil moves the rupee is a separate question. The 28 July 2026 piece on the rupee and oil found that across 246 month-ends from January 2006, months when Brent rose were months when the rupee tended to strengthen. The textbook link, oil up and rupee weaker, appeared only once the rupee was measured against the broad dollar index: a correlation of +0.204 over three months, which the piece put at about 4% of the variation.
Start here
- 18 October 2026. Trump waived a 100% tariff on Russia’s top oil and gas buyers. Rubio named India, an “On the record” piece, found that China and India declared 93.6% of the Russian crude reported in importers’ 2025 UN returns, and that Russia supplied 53.7% of India’s crude imports by weight in July 2026, the highest share in India’s monthly returns since at least January 2021, though July and August 2023 have no world total to compare.
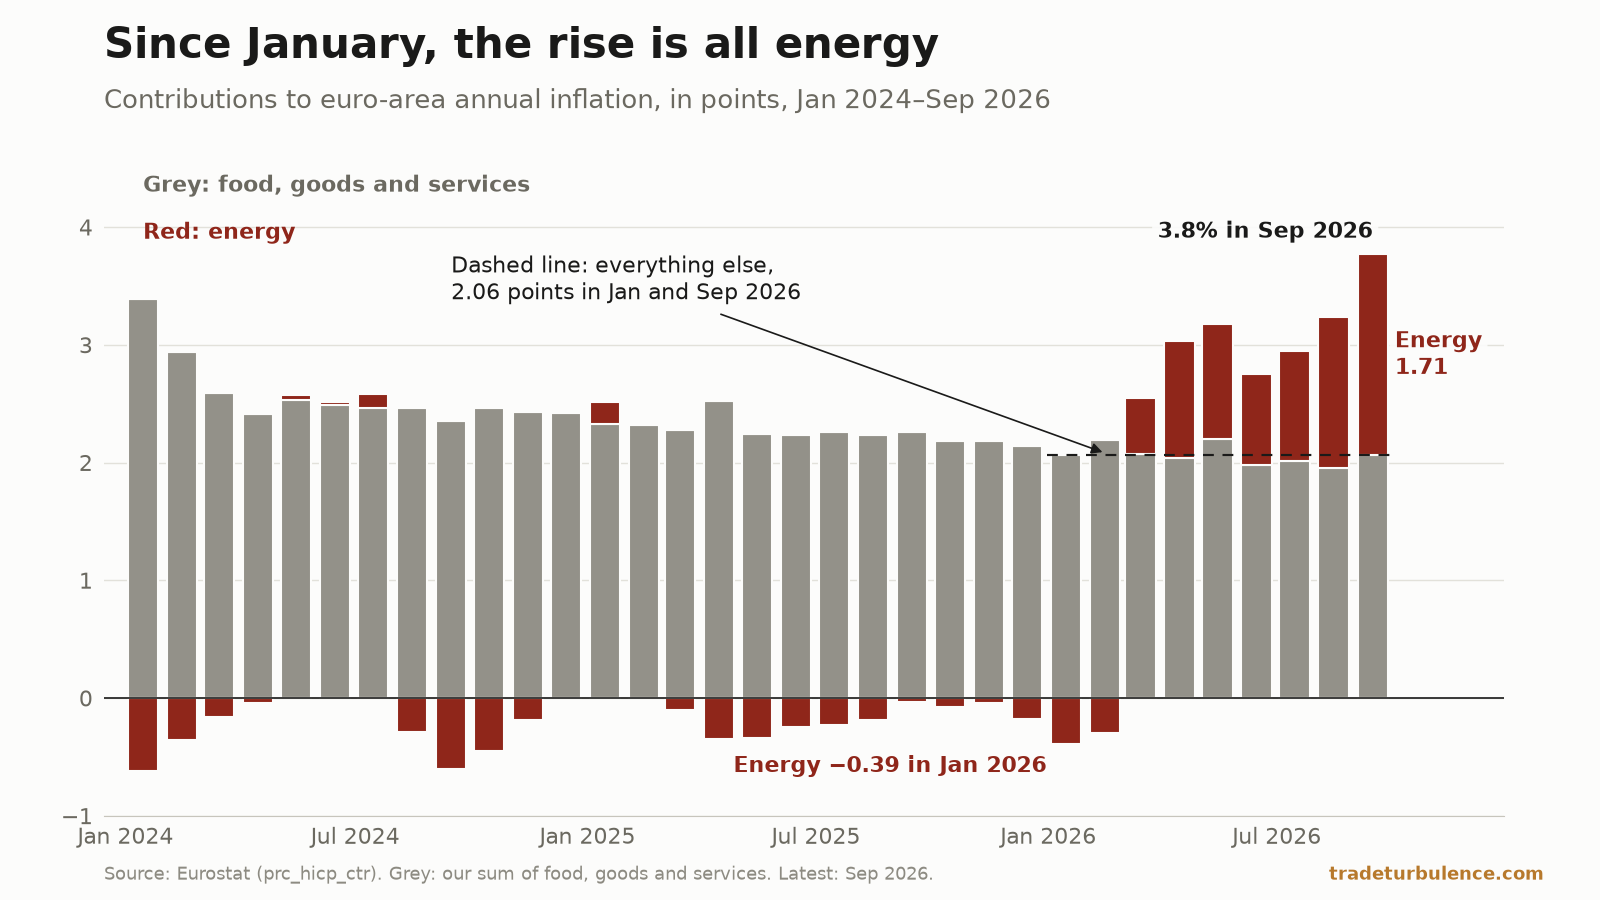
- 17 October 2026. Euro-area inflation is 3.8%. Without energy, it is 2.3% found, on Eurostat’s figures, that energy contributed 1.71 points of the euro area’s 3.8% inflation in September 2026, that the rate excluding energy was 2.3%, as in January, and that the price index for fuels for personal transport was the highest in Eurostat’s series from 1996.
- 12 October 2026. Brent rose 10% in a week. In rupees it set a record found that a barrel cost ₹13,051 on 2 October, the most in a series back to 1987, and that the day’s $20.69 rise was the largest one-day rise in dollars in the series.
- 11 October 2026. Brent rose 23% in a month. The Hormuz counts point both ways found that a 30-day rise as large as Brent’s 22.69% to 6 October, measured from 4 September, the last print at or before 30 days earlier, had come on 289 of 9,081 days since 1987, 6 October included, while PortWatch and Lloyd’s List, counting different ships, put September’s Hormuz transits at 109 and at least 477.
- 28 July 2026. The rupee-oil link only appears once you remove the dollar found that, in monthly data from January 2006 and measured against the dollar alone, the rupee tended to strengthen in months when Brent rose, and weakened with oil only once the broad dollar index was stripped out.
What the data cannot show
Why the price moves. The series records when and by how much, not why. The only account of cause in this guide is the EIA’s, quoted as its own.
A spot price in nominal dollars. Brent here is the EIA’s daily spot price, not the futures contract, and it is published days after the market. Real figures are in September 2026 dollars, deflated by the US consumer price index. For a buyer paying in another currency, the inflation that matters is different.
A transit is not a barrel. PortWatch counts ships of five types from their AIS signals. A ship with its transponder off is not counted, so the count is a floor. PortWatch also revises its history, so the counts here are as PortWatch served them on 18 October 2026.
The EIA’s flow figure is quarterly and estimated. As of its October outlook, released on 6 October 2026, the EIA’s latest estimate in barrels a day was for the second quarter of 2026. For September 2026 that outlook gave only a direction, from Vortexa’s ship-tracking data, and the EIA revises its shut-in estimates from one month’s outlook to the next.
Brent in rupees is arithmetic. It multiplies two published series, so it is not what any Indian refiner paid.
Output decisions. The site has no series on OPEC+ production targets, and this guide reports none.
The Stress Index describes conditions, not the future. Its history before 2020 is a reconstruction.
Where to follow it
- Brent: the daily price since 1987, ranked against its own past five years, with its band and lag.
- Brent in rupees: Brent’s dollar price converted at the daily rupee rate, with its record.
- The rupee: rupees per dollar since 1973, ranked the same way.
- The Stress Index: the Energy costs pillar and its two signals, each with its observation date. The methodology sets out how each is scored.
- The Strait of Hormuz: daily transits as a 30-day average against the 2019–2023 baseline.
- The Outlook: the site’s nowcasts and two-week ranges for US fuel prices, each shown with its 80% range and its record while it passes the page’s test, and withheld, with the reason, when it does not.
- India and Saudi Arabia: each economy’s figures, sourced and dated.
- The topics Iran and the Gulf and Shipping and chokepoints.
Sources for this guide
- 1 Crude Oil Prices: Brent — Europe (DCOILBRENTEU), daily, $ per barrel · U.S. Energy Information Administration via FRED
- 2 Consumer Price Index for All Urban Consumers (CPIAUCSL) · U.S. Bureau of Labor Statistics via FRED
- 3 India / U.S. Foreign Exchange Rate (DEXINUS), rupees per dollar · Federal Reserve Board via FRED
- 4 Euro foreign exchange reference rates for the rupee and the dollar (rupees per dollar, crossed via the euro) · European Central Bank
- 5 Daily chokepoint transit data (Strait of Hormuz) · IMF PortWatch
- 6 Daily Chokepoints Data: dataset description (transit calls, ship categories, AIS source) · IMF PortWatch
- 7 Amid regional conflict, the Strait of Hormuz remains critical oil chokepoint (Today in Energy, 16 June 2025) · U.S. Energy Information Administration
- 8 Short-Term Energy Outlook, August 2026 · U.S. Energy Information Administration
- 9 Short-Term Energy Outlook, September 2026 · U.S. Energy Information Administration
- 10 Short-Term Energy Outlook, October 2026 (released 6 October 2026) · U.S. Energy Information Administration
- 11 TradeTurbulence Stress Index (v3) and its methodology · TradeTurbulence
- 12 Indicator pages: Brent, Brent in rupees, rupee · TradeTurbulence
- 13 Strait of Hormuz route page · TradeTurbulence
Every piece on this topic
- Trump waived a 100% tariff on Russia's top oil and gas buyers. Rubio named IndiaOn the record
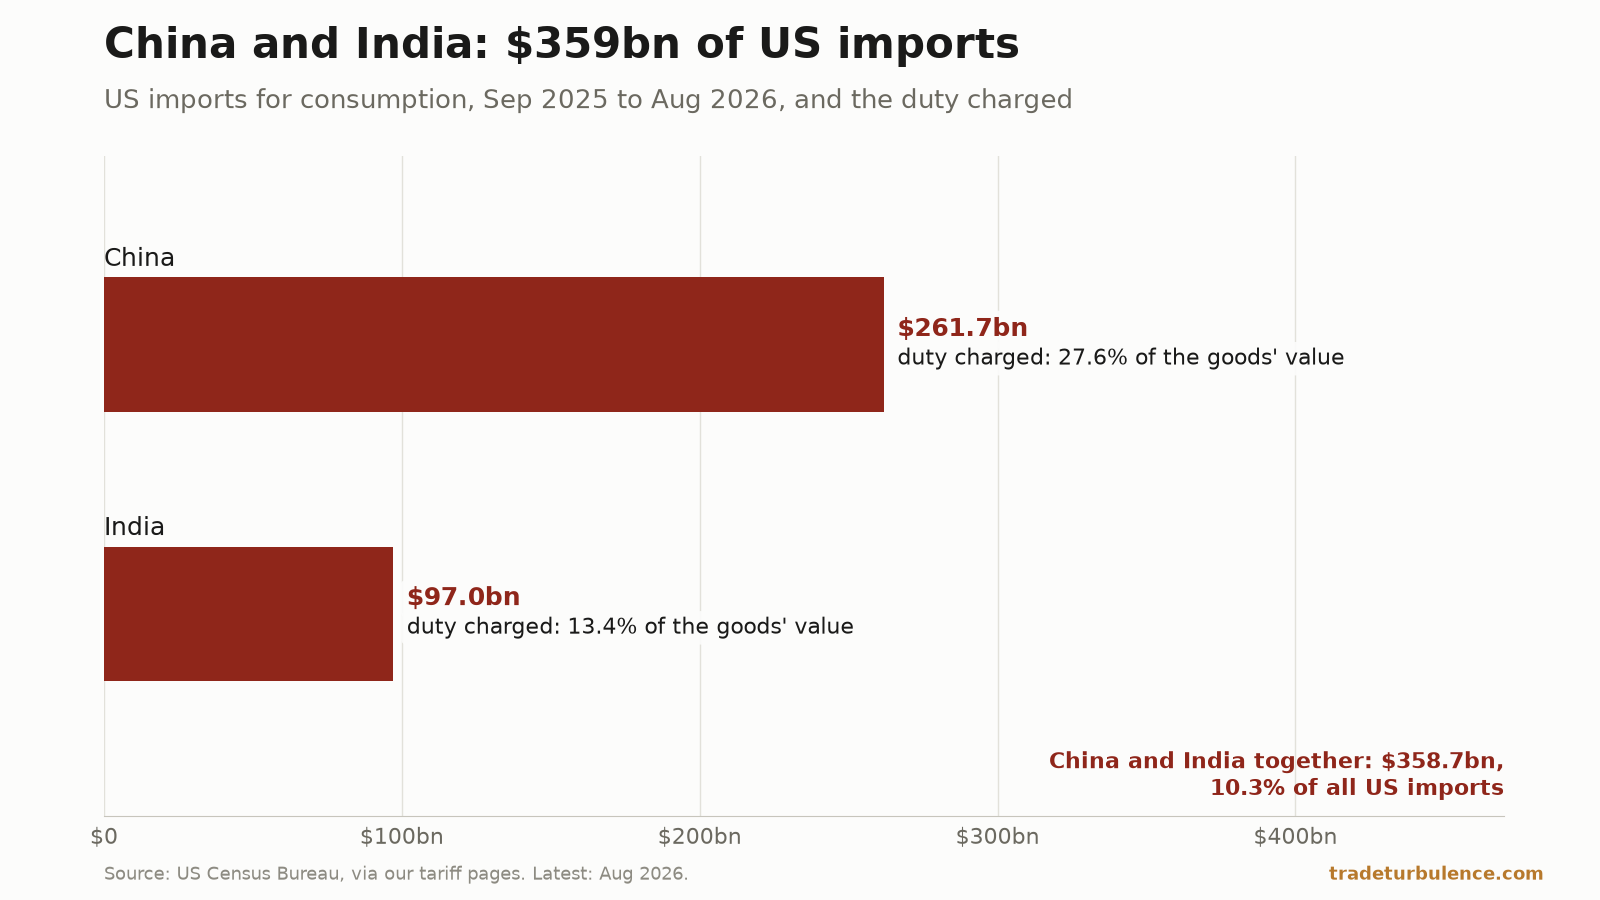
The order names no buyer. China and India, the top buyers in importers' 2025 UN returns for Russian crude, sold the US $359bn of goods in the year to August.
- Euro-area inflation is 3.8%. Without energy, it is 2.3%Macroeconomics & policy
Euro-area inflation was 3.8% in September 2026. Excluding energy it was 2.3%, as in January; transport-fuel prices were the highest in Eurostat data from 1996.
- Brent rose 10% in a week. In rupees it set a recordThe week
Brent was $125.44 on 6 October, 10.1% above 29 September. On 2 October a barrel cost ₹13,051, the most in a series from 1987; by 6 October, 7.4% less.
- Brent rose 23% in a month. The Hormuz counts point both waysMarkets
Brent rose 22.7% from 4 September to 6 October. PortWatch has 109 Hormuz transits in September; Lloyd's List, counting a different set of ships, at least 477.
- The index went calm the week oil went violentMacroeconomics & policy
The Stress Index printed Settled on 12 August with its energy score above 90. In 4,814 trading days since 2008, that pairing had never appeared before.
- Brent is high. It is not extreme.Markets
Brent at $91.82 sits at its 78th percentile: 271 of the past 1,260 trading days were dearer. The Strait of Hormuz ran July at 18% of its pre-war baseline.
- The Strait of Hormuz hit zero three times. It is still at 18%.Geopolitics & trade
Transits through the Strait of Hormuz fell from 152 on 22 February to zero on 13 March. July ran at 16.5 a day against an 89.7 baseline — 18% of normal.
- Saudi Arabia entered the war. The index cannot see it yet.Geopolitics & trade
US and Saudi forces struck Iran-backed militias in Iraq on 29 July. Every series in the Stress Index predates it — the oldest by 89 days. What that hides.
- The stress index reads Normal. Nothing inside it does.Macroeconomics & policy
The TradeTurbulence Stress Index sits at 49.0 — energy 86.7, trade activity 10.4. Three months in 221 have carried that signature. They ended differently.
- The rupee-oil link only appears once you remove the dollarMarkets
Oil rises and the rupee weakens — except the raw data says the opposite. Twenty years of monthly observations show what is actually driving both.
- Ukraine hit Iran-bound ships in the Caspian. Oil is up 22%.Geopolitics & trade
Ukraine's Caspian strikes fused two wars into one supply line. Brent has round-tripped from $71 to $138 to $68, and the price data stops before the attack.