Europe's gas price was 8.6 times America's, most since March 2022
Europe's gas price averaged $25.42 per mmbtu in September 2026, 8.62 times the US's $2.95, World Bank data show. The ratio was last higher in March 2022.
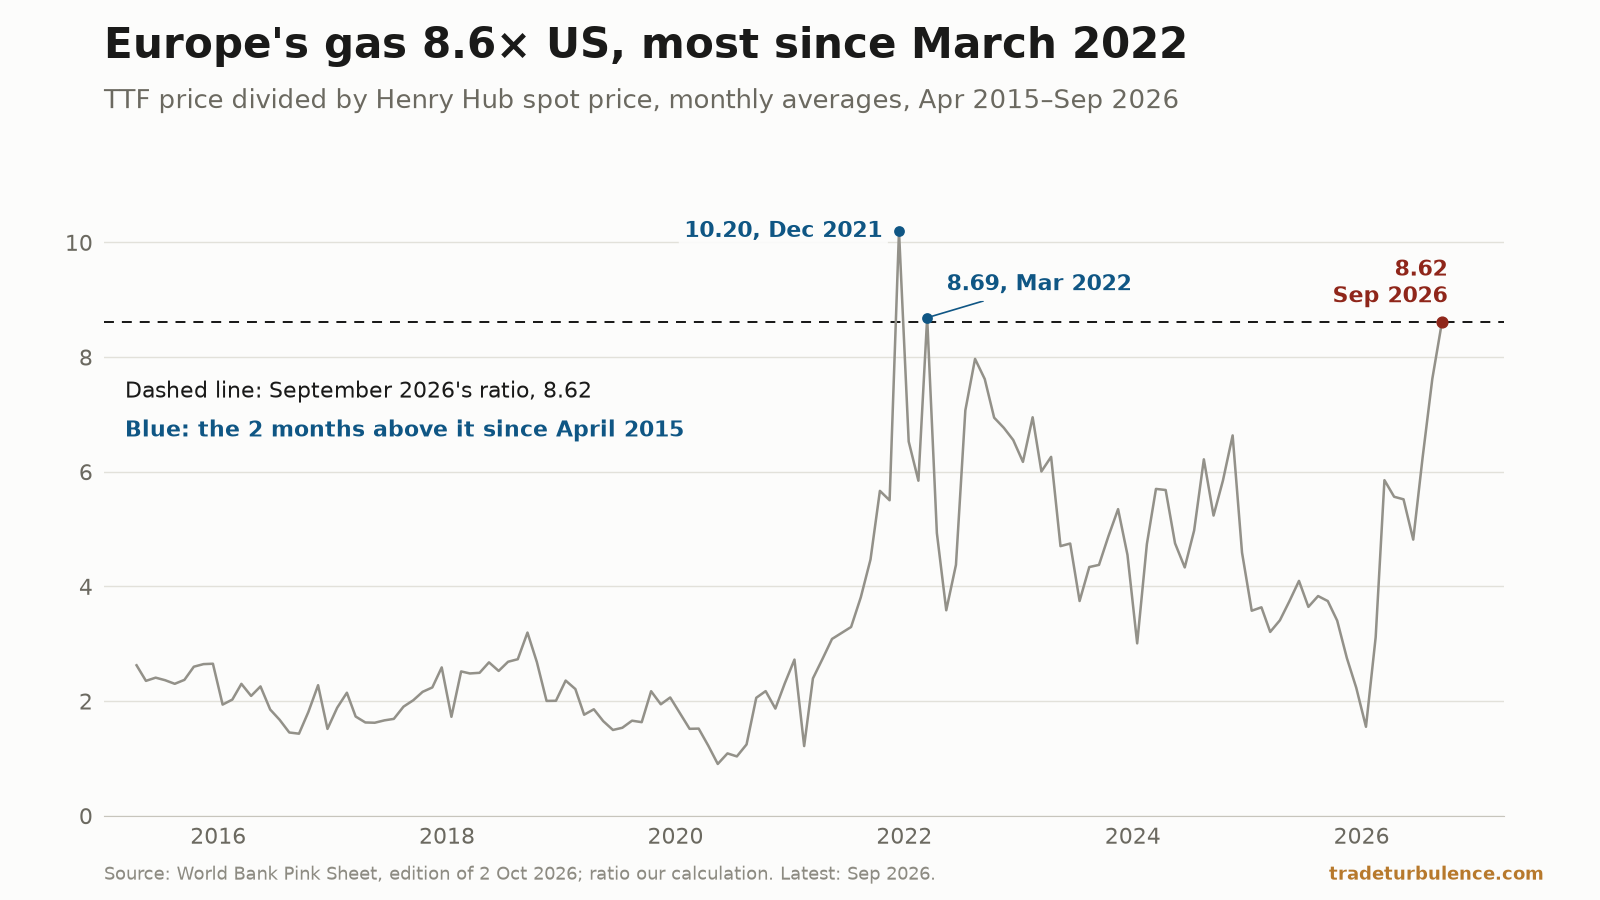
Europe’s natural gas price, the Netherlands Title Transfer Facility (TTF) price in the World Bank’s monthly data, averaged $25.42 per million British thermal units (mmbtu) in September 2026. The US price, the spot price at Henry Hub, Louisiana, averaged $2.95. Europe’s was 8.62 times the US’s, the highest ratio since March 2022 and the third-highest of the 138 months since April 2015, when the World Bank’s European series became the TTF price. Only December 2021, at 10.20, and March 2022, at 8.69, were higher. A year earlier the ratio was 3.74.
Only two months since April 2015 had a higher ratio than September 2026
Both prices are monthly averages in nominal US dollars from the World Bank’s Pink Sheet of commodity prices, the edition of 2 October: Europe the “Netherlands Title Transfer Facility (TTF)” since April 2015, the US the “spot price at Henry Hub, Louisiana”. The ratio is our calculation; with both legs in dollars, it needs no adjustment for inflation.
Since April 2015 the ratio has been 8 or more in three months: December 2021, March 2022 and September 2026. In the 53 months between March 2022 and September 2026 it peaked at 7.97, in August 2022. Its median was 2.01 in April 2015–December 2020 and 4.57 in 2023–25.
Before April 2015 the European series is a different price: an “average import border price and a spot price component, including UK” from April 2010, and one that “excludes UK” in June 2000–March 2010; earlier years are not described. On it, back to January 1960, the ratio never reached 6, so September also ranks third of all 801 months. The IMF’s prices, republished by FRED with its permission, give 8.63, second only to December 2021 in data from 1992; on them March 2022 was 8.39.
In dollars, the gap of $22.47 was wider in 14 months of 2021–22
Europe’s price rose 128.6% in the year to September and the US price fell 0.7%. Our 17 October piece on euro-area inflation reported Europe’s level, the highest since December 2022; it is the US price that sets the ratio apart. Europe’s August 2022 average, $70.04, the highest nominal month in its series from 1960, was 2.76 times September 2026’s. But the US price was then $8.79, 2.98 times its September 2026 level, so the ratio was 7.97.
In dollars, Europe’s price was $22.47 above the US price, the widest gap since December 2022’s $30.54 but only 15th of the 138 months since April 2015; all 14 wider months fell in October 2021–December 2022.
The daily Henry Hub price of the US Energy Information Administration (EIA), on FRED, is fresher. It averaged $3.125 over the 14 days published for 1–20 October, 5.9% above September’s average. EIA’s Short-Term Energy Outlook of 6 October said: “Ample natural gas inventories, relative to the previous five-year average, limit upward price pressures in our forecast.” The prices themselves do not say why the ratio moved.
What this cannot settle
These are benchmark prices, not what buyers paid. Each is a monthly average of one quoted price, at the TTF and at Henry Hub. The Pink Sheet carries no European or US contract price for the period since April 2015, and none of its series is a freight rate for moving gas between the two. Before April 2015 the European series measured a different price, so earlier months are context, not a like-for-like record.
Against Asian LNG, the comparison depends on the measure. The World Bank’s LNG price for Japan, the only one of its three gas prices described as an “import price, cif”, with the latest two months estimated, was $14.25 in September, $11.17 below Europe’s, the widest gap since December 2022. The IMF’s “Global price of LNG, Asia”, a benchmark price in the IMF’s note on FRED, averaged $26.64, above Europe’s.
What to watch
3 November. The World Bank’s next update, with October’s averages. At a US average of $3.13, EIA’s 1–20 October mean rounded to the Pink Sheet’s two decimals, Europe’s would need to be $27.19 or more for the ratio to pass March 2022’s, and $31.92 or more to pass December 2021’s; an unchanged $25.42 would give 8.12.
$3.17 and $2.92. With Europe’s price unchanged, a US October average of $3.17 or less keeps the ratio at 8 or above, and $2.92 or less would take it above March 2022’s. EIA’s daily price was at or below $2.92 on one of its 14 days for 1–20 October.