Copper is a record in real terms. Most base metals are not
Copper averaged $14,474 a tonne in September 2026, a World Bank record from 1960 and a real one on our deflation. It gave 65% of base metals' 12-month rise.
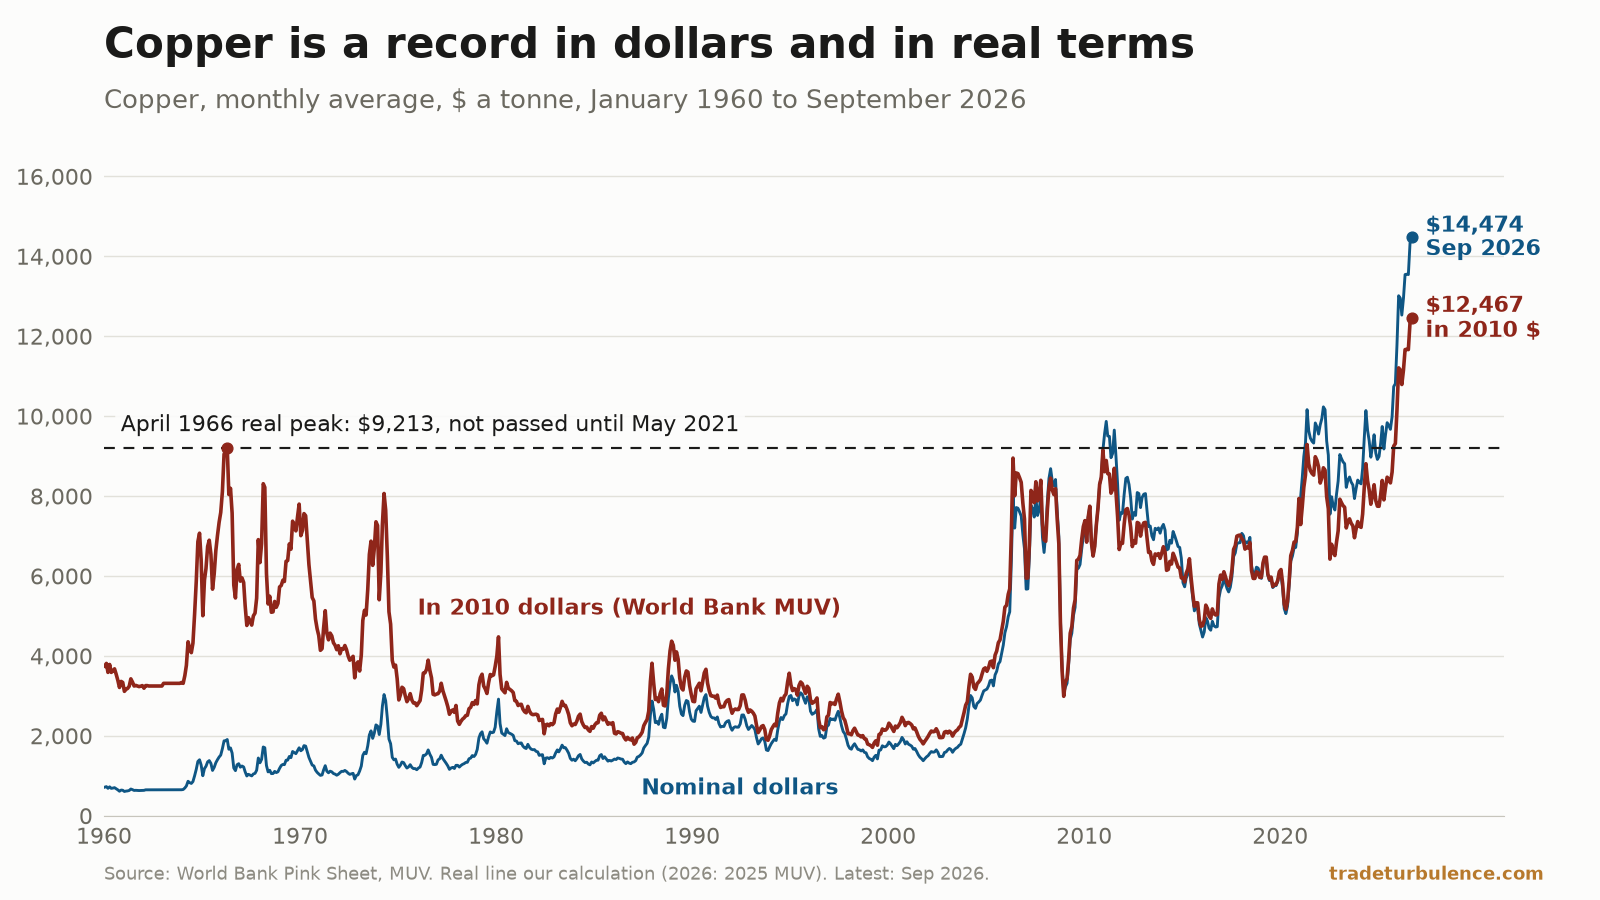
Copper averaged $14,474 a tonne in September 2026, the highest in the World Bank’s monthly series, which starts in January 1960, and 45.0% more than a year earlier. It is also a record in real terms, on our deflation of those prices by the World Bank’s MUV index, 2026 at 2025’s value: 22.8% above December 2025, the highest real month before 2026, and 35.3% above the April 1966 peak, not passed until May 2021. None of the other five base metals is at a high in September, in dollars or in real terms. Copper supplied 65% of the base-metals index’s 12-month rise.
Five new highs in nine months
The figure is the World Bank’s monthly average of the London Metal Exchange settlement price for grade A copper, in nominal US dollars, from its Pink Sheet of commodity prices. The edition carrying September came out on 2 October. The latest figure is September’s average, not a daily price.
A scan of all 801 months puts September first. It is the fifth month of 2026 to set a new high: January at $13,012, May at $13,543, June at $13,552, August at $14,326 and September at $14,474. The step from August was small, $148 or 1.0%. The step from last year was not. Before 2026 the highest month was December 2025, at $11,785; before 2025 it was March 2022, at $10,231. September is 41.5% above that 2022 peak, and the average for January to September 2026 is $13,431.
A second publisher agrees. The International Monetary Fund’s copper series, distributed by FRED, sits within 0.47% of the World Bank’s in every month from January 2025 to July 2026; as fetched on 17 October it had not published August or September. The October edition revised no metals prices against the previous upload.
In monthly real terms, the 1966 peak stood for 55 years
The World Bank publishes real prices only as annual averages, in 2010 dollars, deflated by its Manufacturers Unit Value index (MUV): the dollar unit value of manufactured goods exported by 15 countries. On that published series, 2025 was already copper’s dearest year since 1960, at $8,568 in 2010 dollars, just ahead of 2021’s $8,516.
Its monthly series is nominal only, so the monthly real figures here are our calculation on the World Bank’s deflator: each month’s average divided by the MUV for its year. The annual file of 2 September 2026 has no MUV for 2026, so the 2026 months are divided by 2025’s, 116.1. Applied to the annual averages, the method reproduces the World Bank’s own real figures to within 0.3% in every year.
In those terms the high-water mark of the 1960s was April 1966: $9,213 in 2010 dollars, from $1,907 a tonne at the time. No month passed it until May 2021, 55 years later. The real high was reset in November 2025 and again in December 2025, at $10,151, the highest real month before 2026. September comes to $12,467 in 2010 dollars: 22.8% above December 2025 and 35.3% above April 1966. No month from 1960 to 2025 was dearer in real terms. Within 2026 the previous real high was August, at $12,339, and September is 1.0% above it; both months share the 2026 deflator, so that comparison does not depend on it.
The deflator would need its largest rise on record to undo that
A 2026 MUV above 2025’s 116.1 would lower every 2026 figure. For September to fall back to December 2025’s real level, the 2026 MUV would have to reach 142.6, a rise of 22.8% in one year. The largest annual rise in its record, which goes back to 1960, is 21.7%, in 1974. In 2025 it rose 0.9%.
That does not make the MUV the right deflator for every purpose. It measures the unit value of manufactured exports, not what households pay. It is the World Bank’s choice for its own real commodity prices, and on it the record holds.
Copper supplied 65% of the base-metals rise
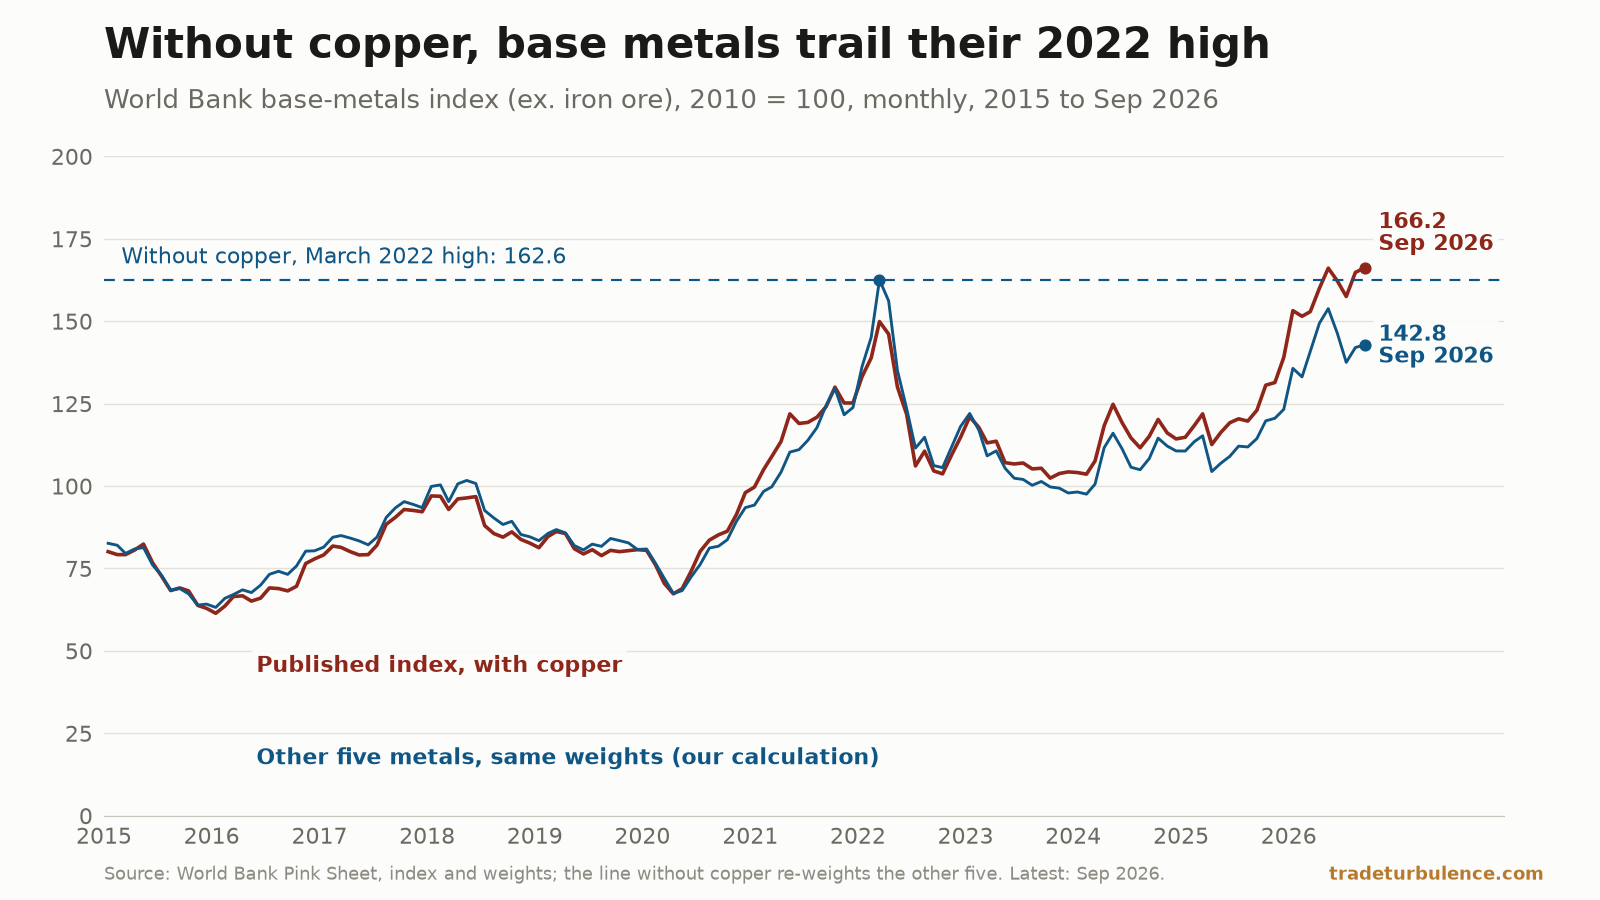
The World Bank’s index of base metals (iron ore excluded, 2010 = 100) also set a high in September, at 166.2, though by a tenth of a point over May’s 166.1. It is up 35.1% on the year. Copper carries 47.4% of the index’s weights, aluminium 32.9%, nickel 9.9%, zinc 5.0%, tin 2.6% and lead 2.2%.
Rebuilding the index from those weights reproduces the published figure to within 0.1 point in every month since 2010, which allows its 43.2-point rise over 12 months to be split by metal. Copper supplied 65%, aluminium 22%, zinc and tin 6% each, nickel 1% and lead nothing.
Take copper out and keep the other five on the same weights, and the index stands at 142.8. That is 12.1% below its March 2022 high and lower than in April, May and June 2026. With copper in, the published index stood at 149.9 in March 2022 and 166.2 in September 2026.
Tin’s 2026 highs hold in real terms. Aluminium’s are in dollars only
Aluminium set new highs in nominal dollars in April, at $3,600, and in May, at $3,666, passing a peak from June 1988 of $3,578. It has eased since: September’s $3,283 is 89.6% of May’s, though still 23.7% above a year earlier. In real terms, on the same deflation as copper, those are not highs: June 1988’s peak is $4,467 in 2010 dollars, May’s high is 70.7% of it and September 63.3%.
Tin’s highs hold on both bases. It set new highs in January, May and August, the last at $55,385, and each is a high in real terms as well. September’s $53,712 is 97.0% of August’s, and tin’s 55.8% rise on the year is the largest of the six, ahead of copper’s.
Zinc, at $4,021 in September, is at its highest since April 2022 and 91.3% of its December 2006 high in dollars, $4,405, after a 37.1% rise on the year. Nickel is at $16,324, 31.3% of its May 2007 high of $52,179; it is up 8.1% on the year but down 8.1% since January. Lead is down 4.2% on the year, at $1,873, half its October 2007 high of $3,720. In September none of the five stood at its high, in dollars or in real terms.
What this cannot settle
Why copper rose. The World Bank’s file records prices, not reasons. No primary account of the cause was retrieved for this piece, so none is offered. Nor can these series show whether buying by any one country lifted the price; that would need monthly import figures by product, which this analysis did not obtain.
The monthly real figures are ours. They divide a monthly price by an annual index, and the 2026 months borrow 2025’s MUV. When the World Bank publishes a 2026 value, the real figures for 2026 will change. A consumer-price deflator would give different numbers again.
A monthly average is not a daily price. These are averages of LME settlement prices, published after the month ends: September’s on 2 October. Daily prices within the month, and prices on other exchanges, differ from them.
Old comparisons cross changes in the price basis. The World Bank’s aluminium and nickel prices are LME settlement prices from 2005 and cash prices before; zinc changed grade and basis in April 1990. Aluminium’s 1988 peak was measured on the older basis.
The index weights are more than two decades old. They come from the export values of 2002–04. The index without copper is our calculation on those weights, not a World Bank series.
What to watch
$14,474. An October average above September’s would be copper’s sixth new high of 2026. It would take a fall of 18.6% to bring the monthly average back below December 2025’s $11,785.
3 November, if the Pink Sheet keeps its timing. The October edition came out on the month’s second working day; the same day in November is Tuesday 3 November. To reach their records in dollars from September’s levels, tin needs a rise of 3.1%, zinc 9.5% and aluminium 11.7%. The base-metals index has 166.2 to beat.
A 2026 MUV below 142.6. When the World Bank adds 2026 to its annual real series, any MUV below that level leaves September a record in real terms as well as in dollars.