Brent is high. It is not extreme.
Brent at $91.82 sits at its 78th percentile: 271 of the past 1,260 trading days were dearer. The Strait of Hormuz ran July at 18% of its pre-war baseline.

Brent’s newest published spot price is $91.82, dated 27 July 2026. Ranked against its own past five years that is the 78th percentile: 271 of the past 1,260 trading days were dearer, and 68 of this year’s 143 have been. Through the first 23 days of the same month the Strait of Hormuz, which in a normal year carries more than a quarter of the world’s seaborne oil trade, ran at 16.5 vessel transits a day against a pre-war baseline of 89.7. The Stress Index reads 45.7 — Normal.
Crude has been dearer on 271 of the past 1,260 trading days
The EIA’s Europe Brent spot price, FOB, in dollars a barrel, distributed daily through FRED, is at $91.82 on 27 July. Against the 1,260 trading days from 2 August 2021 that is the 78.5th percentile — the site’s oil indicator files it as High, one band below Very high, which begins at 80.
Crude was dearer on 271 days of that window and cheaper on 987; two, including 27 July itself, printed exactly this level.
Within 2026 it is more ordinary still. Of 143 daily observations this year, 68 came in above $91.82 and 52 at or above $100. Nine sat at $120 or more. The low for the year is $61.08 on 7 January and the peak $138.21 on 7 April, within 4% of the all-time nominal high of $143.95 set on 3 July 2008. The 27 July price is 33.6% below that peak.
The strait made no comparable return
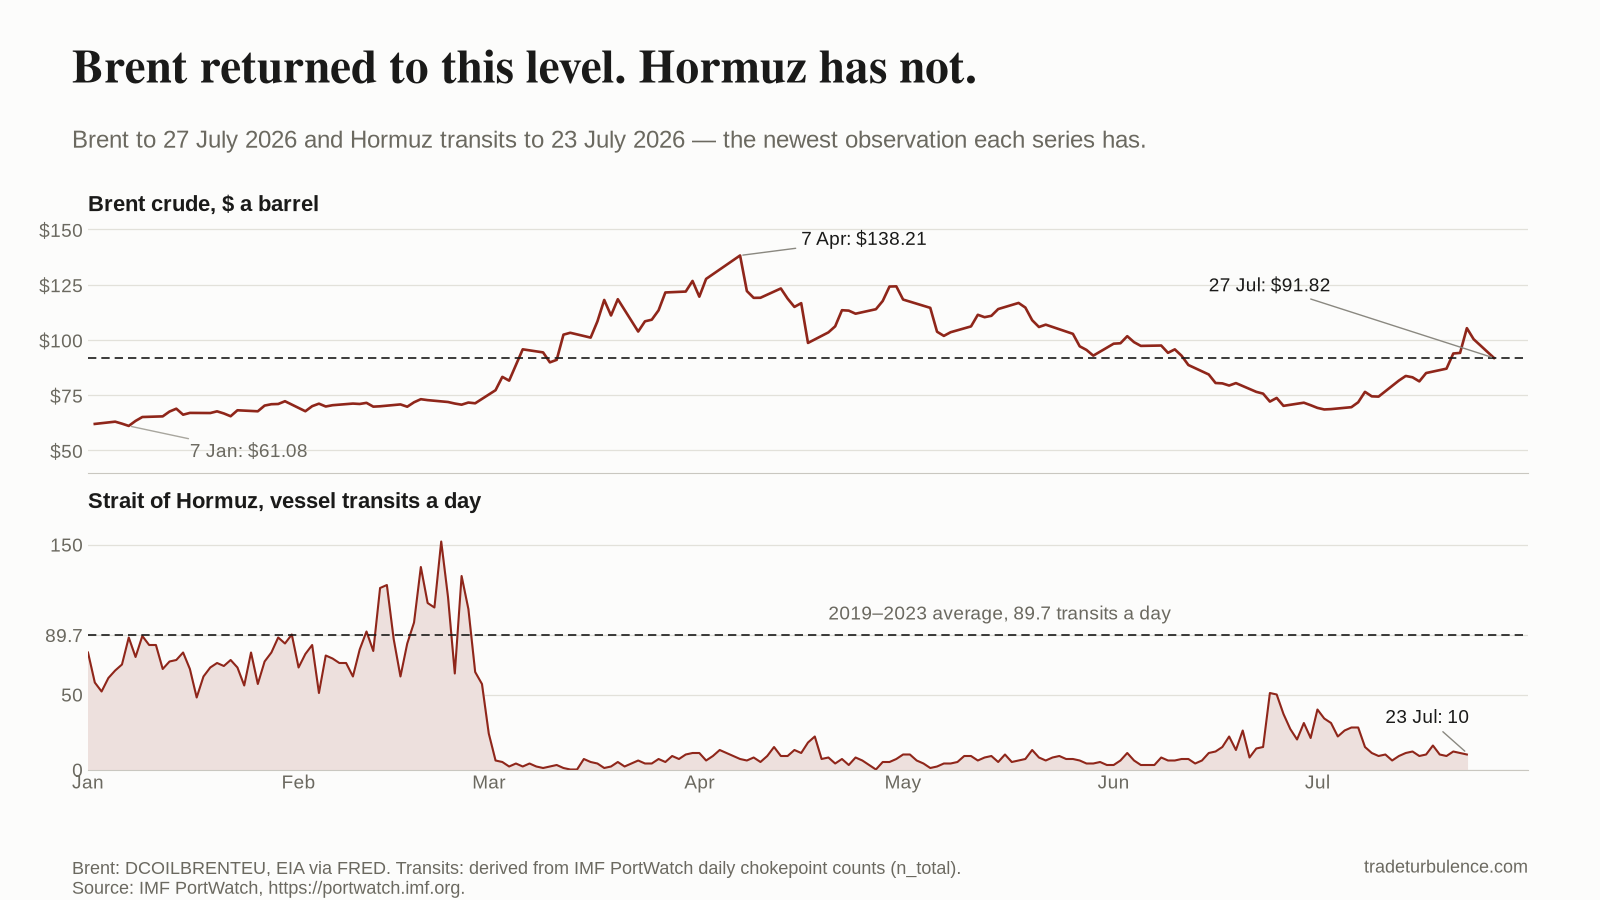
Daily transit counts, derived from IMF PortWatch satellite AIS data, run to 23 July. Across those 23 days the strait carried 16.5 vessels a day against a 2019–2023 baseline of 89.7 computed over 1,765 days: 18.4% of normal, with deadweight capacity at 15.9%. The last day on the record, 23 July, carried 10 vessels; the 30-day mean is 20.5, 77.1% below the pre-disruption level.
Lloyd’s List Intelligence, counting from commercial tracking rather than this dataset, put the week of 20–26 July at 39 transits, down from 82 the week before, with 70% of that traffic untraceable by AIS and inbound Gulf traffic more than 90% below pre-strike levels.
The two counts track each other until that last week, and then they part. For 13–19 July PortWatch totals 77 against Lloyd’s 82. For 20–26 July Lloyd’s 39 sits below the 42 PortWatch records for the 20th to the 23rd alone, and PortWatch has no rows for the rest of that week. Neither settles which is closer to the water.
The scale underneath is on the EIA’s record: flow through the strait averaged 20 million barrels a day in 2024, about 20% of global petroleum liquids consumption and more than a quarter of seaborne oil trade. The site’s Route Displacement Index reads 9.69 on 26 July against a 2019–2023 mean of 3.85, and sits 0.14 under its record high of 9.83.
What the index scores is the movement, not the level
The Stress Index closed at 45.7 on 30 July, its 50th percentile over five years, against a long-run mean of 50.1 across 4,802 observations. Its energy component reads 91.6 — Severe.
That component and the 78th percentile above are not measuring the same quantity. An earlier piece set out the construction: the component reads Brent’s 20-day realised volatility and its 63-day absolute move, and never sees the price itself. On 30 July those two signals rank at the 94.9th and 86.7th percentiles of their own five years.
The split is visible without any index. Of the 142 day-to-day changes in Brent so far in 2026, 27 were 5% or larger; across the other 1,116 changes in the same window, 36 were. A move of that size has been roughly six times as common this year as across the four years and five months before it, while the price itself sits where it sat on hundreds of ordinary days. High is a statement about where the price is. Extreme, in this index, is a statement about how it got there.
What this cannot settle
Nothing here identifies why the price is where it is. What sits between a transit count and a spot price — inventories, spare capacity, pipeline routing, cargo that left by other means — is in neither series, and any account of it built from these two numbers would be a guess wearing a citation.
A transit count is not a barrel count. It counts hulls that moved, not cargo loaded, and it cannot see a vessel with its transponder switched off. Lloyd’s puts that share at 70% for the week of 20–26 July, which makes each PortWatch figure here a floor on physical movement rather than a full count.
The percentile is a nominal comparison. $91.82 is ranked against dollar prices from 2021 onward, with no adjustment for what a dollar has done since.
Both series are published late. Brent’s newest observation is six days old. Hormuz’s is ten, and it is the only one of the 28 chokepoints in the PortWatch board whose rows stop on 23 July; the other 27 run to the 26th.
What to watch
Whether Brent settles above $93.05. That is the 80th percentile of the same window and the floor of the Very high band, $1.23 above the last published price — and a boundary this market crossed in both directions within the final six trading days on the record, printing $86.99 on 20 July, $105.32 on the 23rd and $91.82 on the 27th.
The July transit total when PortWatch closes the month. The monthly means since the stoppage run 4.8 a day in March, 8.5 in April, 6.5 in May, 15.1 in June and 16.5 through 23 July, still short of a fifth of normal. The post-war daily high remains 51, set on 24 June.
The gap between transits and deadweight. Capacity has fallen further than the count in every month of this disruption: 15.9% of baseline against 18.4% in July. A recovery in vessel numbers without one in tonnage means the small hulls came back and the large ones did not.