Brent rose 23% in a month. The Hormuz counts point both ways
Brent rose 22.7% in the 30 days to 6 October. PortWatch has 109 Hormuz transits in September; Lloyd's List, counting a different set of ships, at least 477.
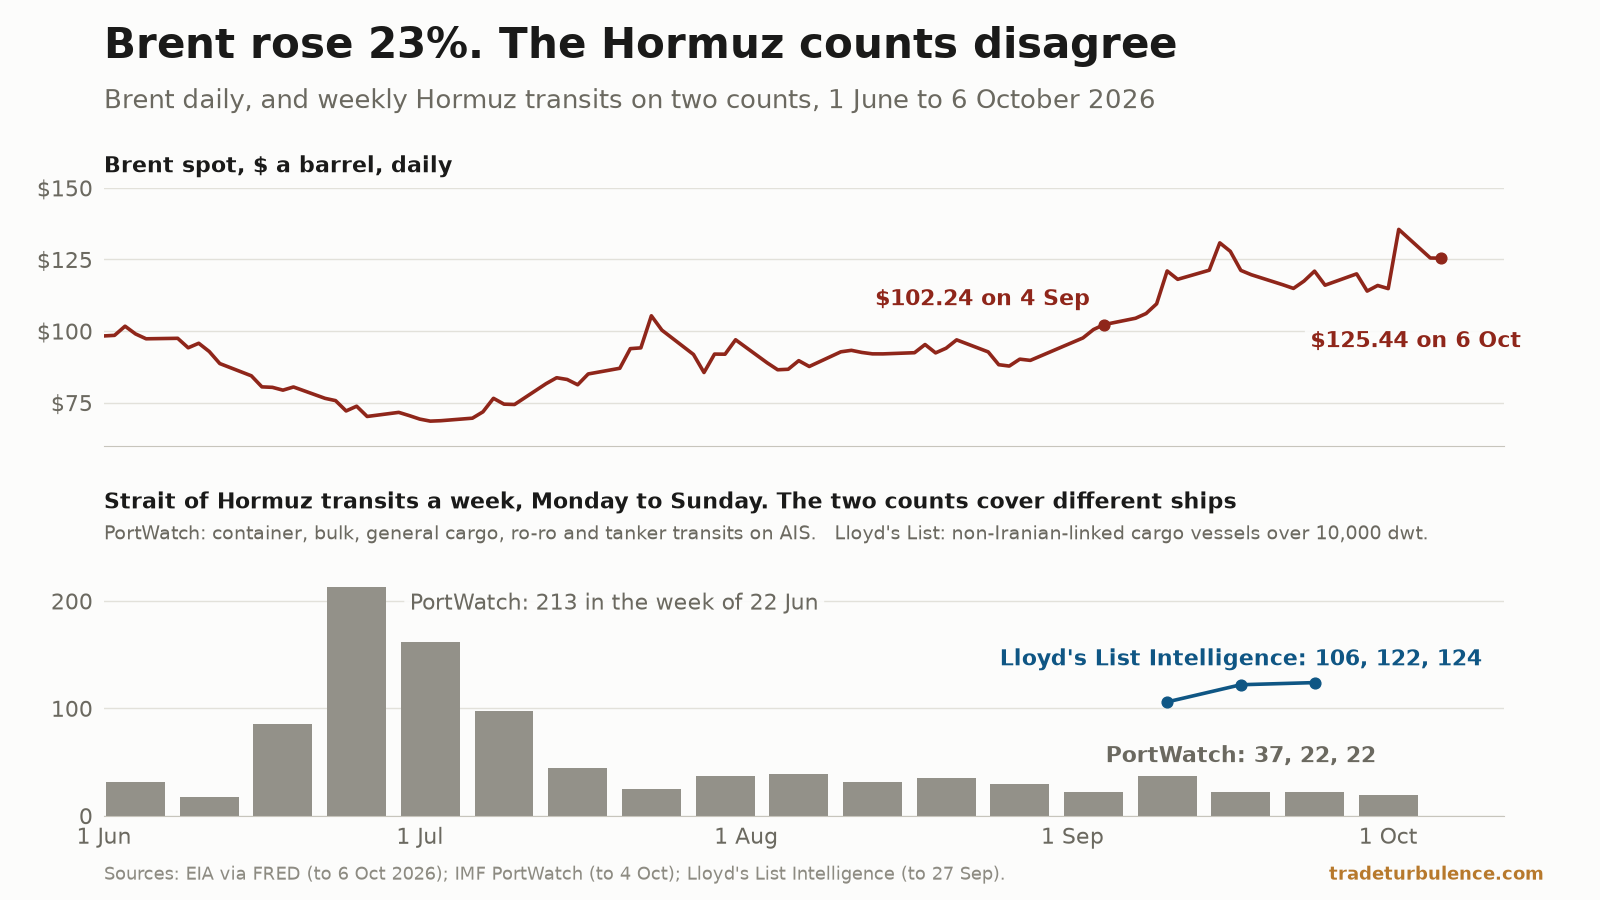
Brent’s latest spot price is $125.44, dated 6 October 2026: 22.7% above the last print 30 days earlier. A rise that large has occurred on 289 of 9,081 days since 1987, 54 of them in 2026. Meanwhile two public tallies of Strait of Hormuz traffic, which do not count the same ships, moved in opposite directions. IMF PortWatch has September at 109 transits, its lowest full month since March. Lloyd’s List Intelligence, counting only non-Iranian-linked cargo vessels over 10,000 dwt, has at least 477, which it calls its highest since the war began. The Stress Index reads 82.5 on 8 October — Severe.
A 30-day rise this large has come on 3% of days since 1987
The EIA’s Europe Brent spot price , distributed daily through FRED, stood at $102.24 on 4 September and $125.44 on 6 October: a rise of $23.20 a barrel, or 22.69%, measured against the last print at or before 30 calendar days earlier, 4 September — the measure the site’s Brent page publishes. The series runs five days behind; 6 October is its latest observation.
Applied to every observation since the series began in May 1987, that measure has been this high or higher on 289 of 9,081 days — 3.2% of them. They cluster: 18 of the 40 calendar years contain at least one, and 22 contain none. The largest on record is +281.4% on 21 May 2020, the rebound from that spring’s collapse.
The level is rarer than the move. Against the past 1,260 trading days, $125.44 is the 98th percentile: crude was dearer on 19 of those days, 12 of them in 2022 and seven in 2026. Before September, the last print at or above this level was the year’s high of $138.21 on 7 April; the latest price is 9.2% below that and 12.9% below the nominal record of $143.95 set on 3 July 2008.
Nearly a fifth of those days belong to 2026
The honest context is that this year has made the rare routine. Of the 289 days, 54 are in 2026 — 18.7% of the total, from 193 trading days out of more than 9,000. Before this year the rate was 235 days in 8,888, or 2.6%.
Twenty-five of the 54 came in one run from 5 March to 10 April, when the 30-day change peaked at +77.6%. The other 29 have come since late July, and 16 of the 19 trading days from 10 September to 6 October qualify. The latest reading is not the peak of this run: the 30-day change reached +42.1% on 15 September.
The path inside the month was not smooth. Six of the 22 daily changes between 7 September and 6 October were 5% or larger in one direction or the other. The largest was +18.0% on 2 October, from $114.82 to $135.51. Only seven one-day rises in the series are bigger, four of them in April and May 2020. The next observation, 5 October, was −7.4%. The 2 October print came within $2.70 of the year’s high; the latest price is 7.4% below it.
PortWatch has the strait at 3.6 ships a day, down from 4.4
IMF PortWatch , which counts transits from vessels’ AIS signals, publishes the Strait of Hormuz to 4 October. Over the 30 days to that date it records 108 transits: 3.6 a day against a 2019–2023 baseline of 82.1, which is 95.6% below. Thirty days earlier, on 4 September, the same average was 4.4.
That is a change of 0.8 of a ship a day, less than one percentage point of the baseline, and it is downward. Across the month the 30-day average never left the range 3.5 to 4.4. No single day carried ten vessels; the busiest carried eight, and 1 October carried none.
By month, PortWatch’s daily mean runs 3.2 in March, 7.1 in April, 3.9 in May, 12.9 in June, 10.2 in July, 4.7 in August and 3.6 in September — the lowest full month since March. Only 15 days in the series, which starts in 2019, show a lower 30-day average than 4 October’s: twelve between 30 March and 10 April, and the three days just before it. Tonnage is lower still, at 2.4% of its baseline against 4.4% for the count. The 30-day average has now been more than 15% below baseline for 214 consecutive days.
Lloyd’s List counts more than four times as many, and rising
Lloyd’s List Intelligence , citing its own Strait of Hormuz Transit Monitor, publishes a regular brief on the strait. Its 8 October edition puts non-Iranian-linked transits at 124 in the week of 21–27 September, against 122 the week before, with 106 of the 124 made by tankers and gas carriers. For September as a whole it counts at least 477, the most it has tracked since the outbreak of war at the end of February, and more than the 469 that its 30 September brief gave for June, during the Memorandum of Understanding period.
Set side by side, the two do not describe the same month. For 21–27 September PortWatch has 22 transits to Lloyd’s 124; for the three weeks from 7 September, 81 to at least 352. For September, 109 to at least 477: 3.6 a day on one count and at least 15.9 on the other. And the direction differs. PortWatch’s total fell from 146 in August to 109. Lloyd’s has movements into the Gulf rising from 160 in July to 198 in August and at least 231 in September.
The gap is wider than it was in June. PortWatch has 388 transits for that month against the 469 Lloyd’s gave: 83% as many, on those figures. For September it has 23% as many. That is two months, not a trend, and the one earlier comparison on this site has not held: the 2 August piece set Lloyd’s 82 for 13–19 July against PortWatch’s 77, a week for which PortWatch now shows 44.
The two are not counting the same ships. Lloyd’s restricts its analysis to cargo-carrying vessels over 10,000 deadweight tonnes and reports the non-Iranian-linked among them. PortWatch’s total is the sum of container ships, dry bulk carriers, general cargo ships, ro-ro vessels and tankers whose AIS signals cross the chokepoint boundary, with the same ship counted again only after 48 hours; its dataset description states no size floor and no ownership exclusion. Those are the stated differences. Neither definition says which way they should push the totals, or by how much.
One August marker was crossed. Another was revised
The 2 August piece was written on a Brent price of $91.82 and named $93.05 as the level to watch. Brent has crossed it nine times since and has been above it on every observation since 1 September, 26 trading days. It has been at $100 or more for 24. The price is 36.6% higher than on 27 July.
The Hormuz markers in that piece cannot be checked against the same numbers, because PortWatch’s history has changed since. It reported 16.5 transits a day for 1–23 July against a baseline of 89.7. The series as fetched today gives 12.1 for those days and a baseline of 82.1, and shows no transits on 23 July where it then showed ten. One marker survives intact: the highest daily count since the collapse is still the 51 recorded on 24 June.
The site’s index registers both halves. The Stress Index, now on its third version, read 82.5 on 8 October — Severe, and higher than every day of its 2010–2019 reference period. Its shipping-routes pillar reads 95.9. Its energy pillar reads 79.7, one band lower, because it scores two things: Brent’s 20-day realised volatility, at 88.1% annualised and above anything in the reference decade, and the inflation-adjusted price, which sits at only the 59th percentile of 2010–2019. Readings quoted in the August pieces are from the previous version of the index and are on a different scale.
What this cannot settle
Which count is closer to the water. PortWatch’s source is vessels’ AIS signals; a ship with its transponder off is not in its total. Lloyd’s List’s figures come from its own transit monitor, with a size floor and an ownership exclusion that PortWatch does not state. Neither publishes enough of its method to reconcile a fourfold gap, and this piece does not try.
Why the price rose. One count says traffic slipped by less than a ship a day; the other says it reached a wartime high. Neither shows a fall in traffic of a size that would stand beside a 23% move in the price, and nothing in these series identifies what does. No dated primary account of the 2 October print was found, so none is offered.
Whether the newest numbers will hold. PortWatch has changed its Hormuz history since August, and its latest weeks may change again. Lloyd’s revises upward as voyage information arrives: its figure for 14–20 September went from 117 to 122 between two briefs.
A transit is not a barrel, and a spot price is not a futures price. A count of hulls says nothing about what they carried. The Brent series used here is the EIA’s spot assessment for physical cargoes, in nominal dollars, not the futures contract quoted on most screens.
The windows do not match to the day. Brent’s month runs from 4 September to 6 October, PortWatch’s from 5 September to 4 October, and Lloyd’s complete weeks end on 27 September.
What to watch
$138.21. The year’s high, set on 7 April. The 2 October print stopped $2.70 short of it. Above it, only the $143.95 of July 2008 remains.
14 October, the September CPI. Our nowcast for September CPI gasoline is 8.22% (80% range 6.48 to 9.97; BLS publishes it on 14 October; 8 of the last 12 inside the range), on the Outlook page. It is built from September’s pump prices, so it reflects that month and not the 2 October move.
A PortWatch day with ten ships. There was none in the 30 days to 4 October. A 30-day average back above 4.4 would return it to where it stood on 4 September; one below 2.63 would be a new low for the series.
22 October, the next Lloyd’s brief. Lloyd’s now publishes every other Thursday. PortWatch has 19 transits for the week of 28 September to 4 October. Whether Lloyd’s weekly totals stay above 120 decides if the two counts are still moving apart.