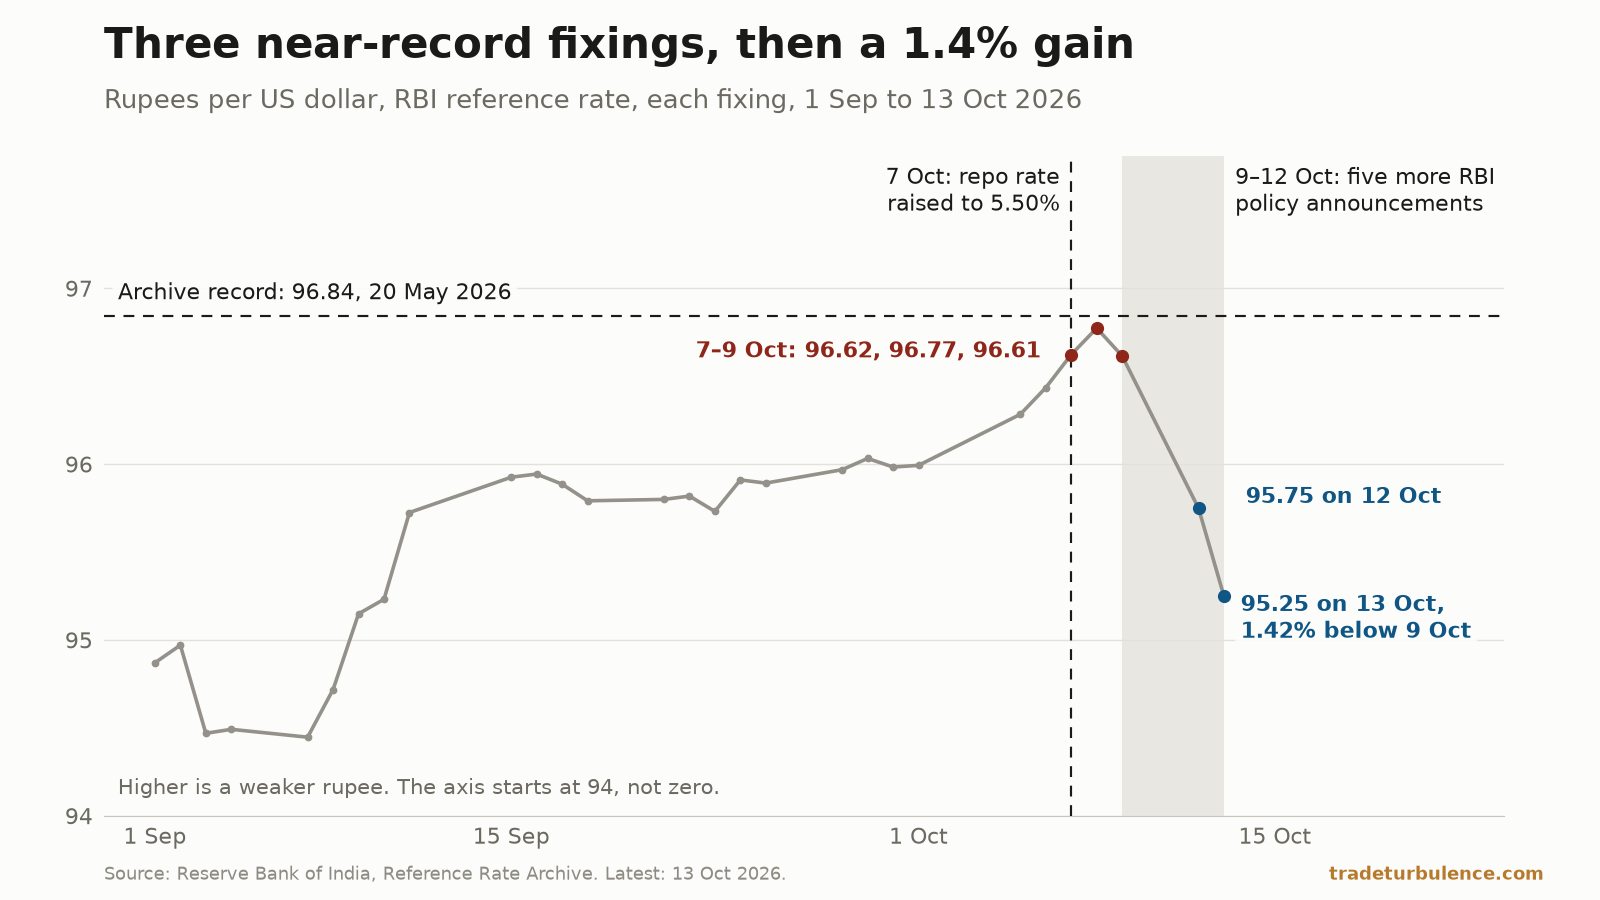
Three of the RBI archive's four weakest rupee fixings came on 7–9 October. From the 9th to the 13th, across five policy announcements, the rupee gained 1.4%.
Markets
Sector and single-name reactions to trade and geopolitical events, and the question of how much of the move survives the week.
7 pieces
Mar 2026 – Oct 2026
Every figure traces to a named public source.
- Brent rose 23% in a month. The Hormuz counts point both ways
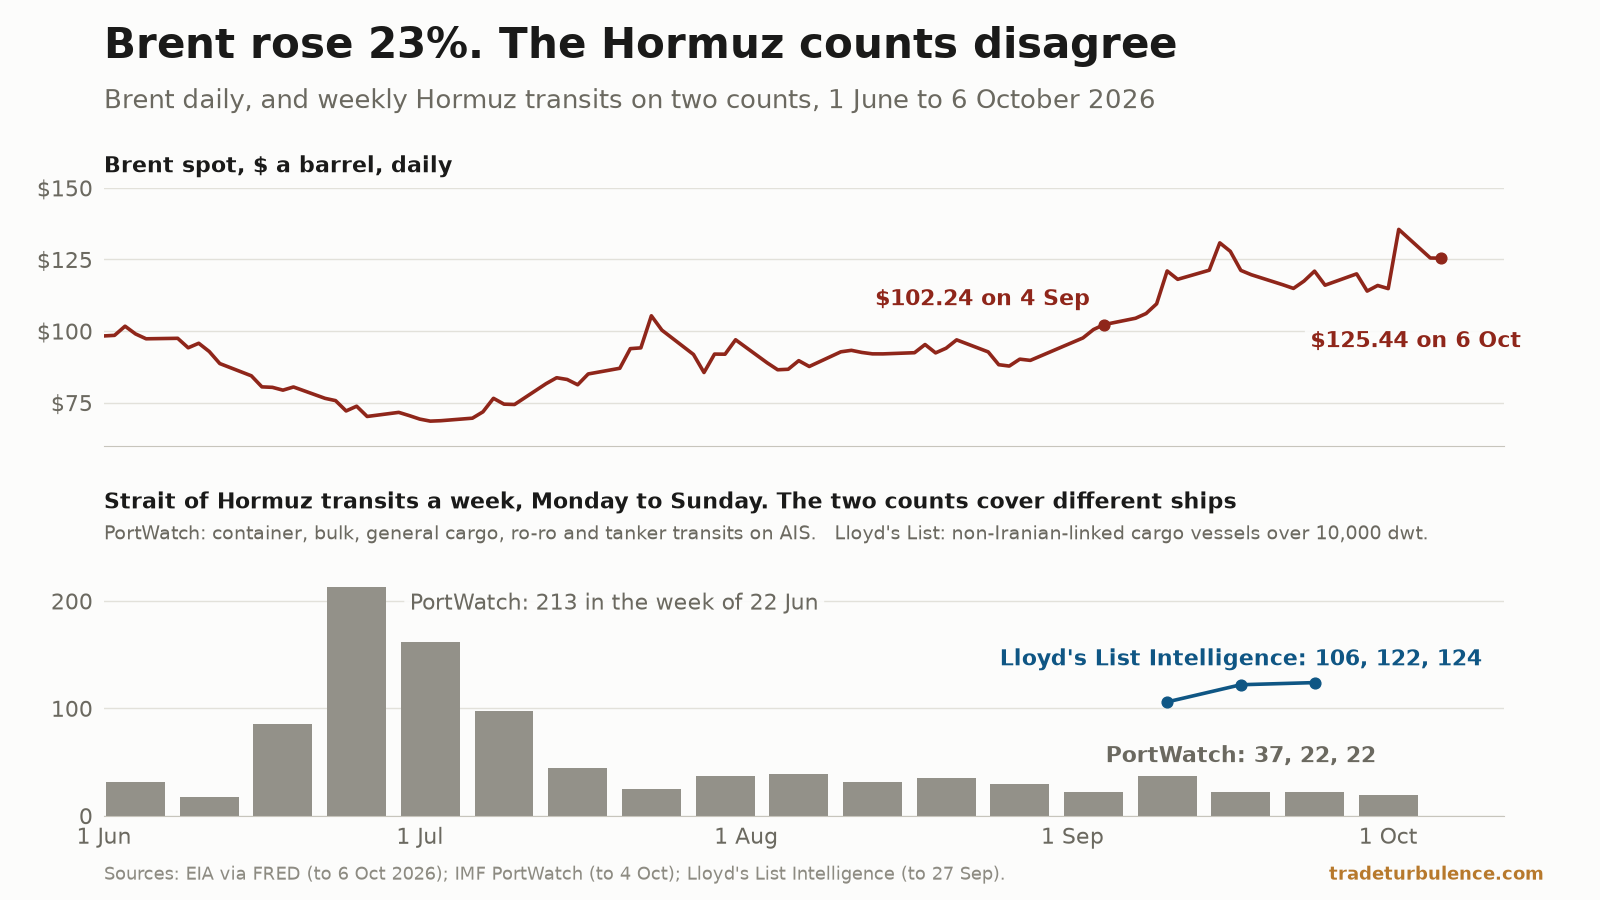
Brent rose 22.7% from 4 September to 6 October. PortWatch has 109 Hormuz transits in September; Lloyd's List, counting a different set of ships, at least 477.
- The dollar is at its 24th percentile. The rupee is at its 97th.
The broad dollar has closed below every session of 2024 and 2025, yet the rupee and yen sit in the weakest tenth of their five-year ranges against it.
- Brent is high. It is not extreme.
Brent at $91.82 sits at its 78th percentile: 271 of the past 1,260 trading days were dearer. The Strait of Hormuz ran July at 18% of its pre-war baseline.
- The rupee-oil link only appears once you remove the dollar
Oil rises and the rupee weakens — except the raw data says the opposite. Twenty years of monthly observations show what is actually driving both.
- Archer Daniels Midland Reaches New Heights: A Comprehensive Analysis of Stock Performance and Strategic Resilience
Explore Archer Daniels Midland's (ADM) significant stock surge to a 52-week high, analyzing its strategic operations, geopolitical impacts, and market dynamics over …
- Iran Conflict and Its Ripple Effect on Global Stock Markets: An In-Depth Analysis
Explore how the recent Iran conflict impacts global stock markets, with detailed sector breakdowns, historical comparisons, and expert insights on future economic …


Other sections
About this section
Geopolitical events have always moved markets, but the transmission mechanism has grown more direct and volatile. Wars shift capital toward defense stocks and away from consumer discretionary sectors. Elections introduce regime uncertainty that can freeze investment or trigger sharp repricings. Sanctions and trade disputes rewrite supply chain maps overnight, sending oil-linked equities and industrial names on divergent paths. This section focuses squarely on the geopolitics-to-markets transmission—how events on the world stage translate into portfolio impact.
Defense stocks have emerged as a distinct asset class, sensitive to budget cycles, conflict escalation, and alliance dynamics. Oil-linked equities respond to supply disruptions, OPEC decisions, and the geopolitical premium embedded in crude. Volatility spikes when geopolitical risk rises, and safe-haven flows into Treasuries, gold, and the dollar reflect the flight from uncertainty. We trace these flows and explain the logic behind market reactions to geopolitical shocks.
Understanding this transmission is essential for positioning. A trade dispute may hurt exporters while benefiting domestic substitutes. A sanctions regime may crater one sector while creating opportunities in compliant alternatives. Elections can reset regulatory expectations and sector valuations. We provide the analytical framework to anticipate these moves rather than merely react to them.