Without computers, chips and fuel, US import prices rose 3.9%
Outside fuel, US import prices rose 6.0% in the year to September 2026; without computers and chips too, 3.9%. Theirs rose 22.9%, most in BLS data from 1984.
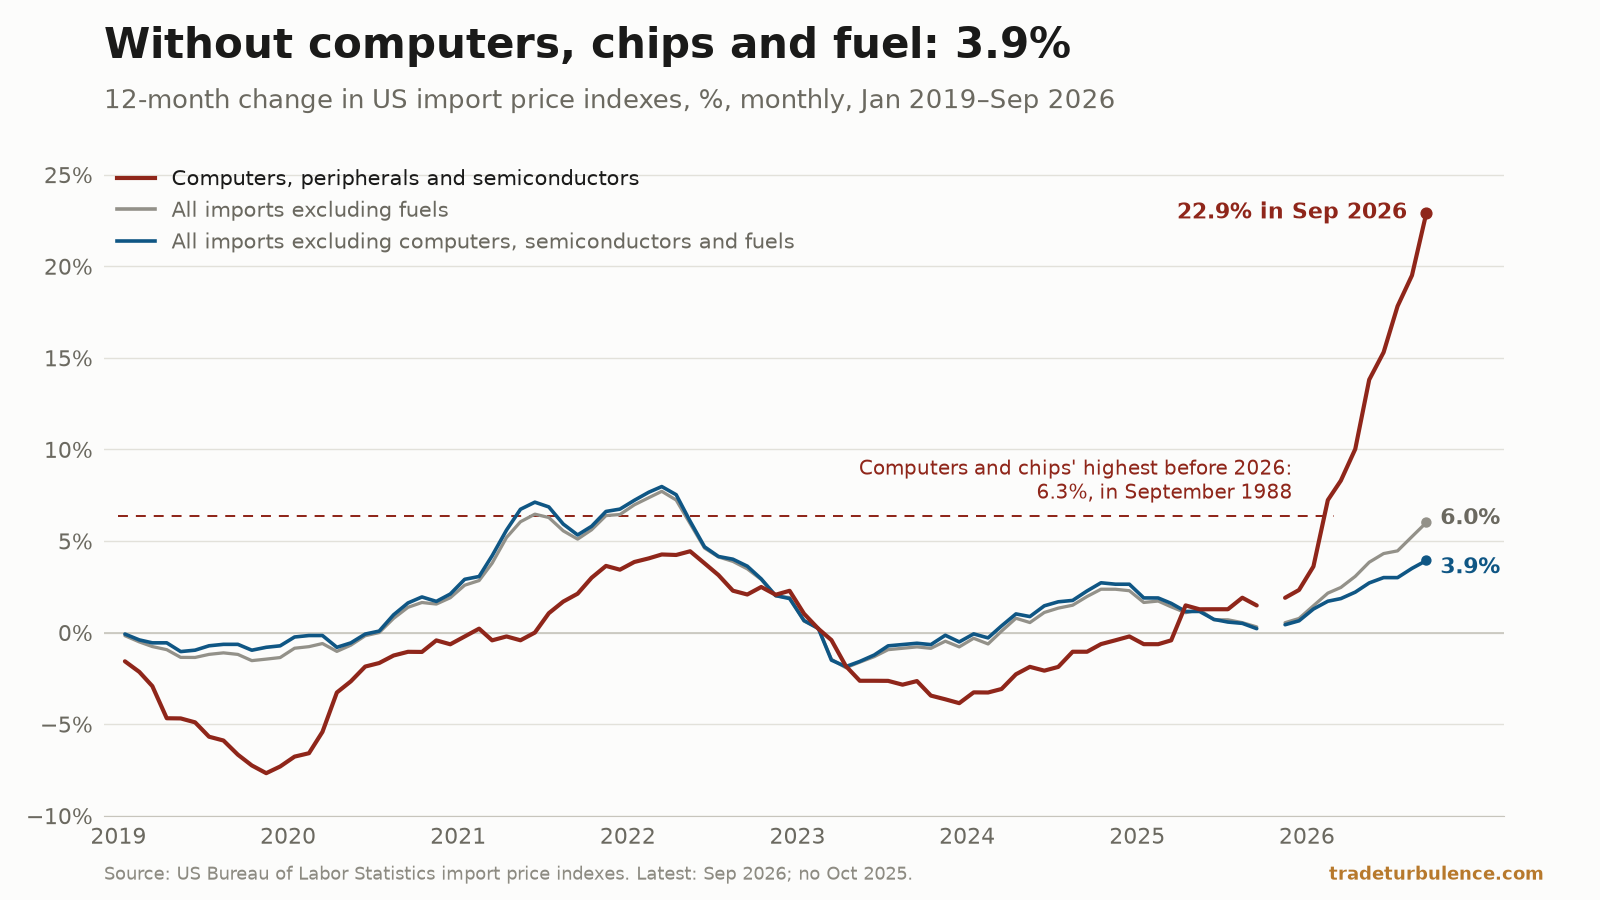
US import prices outside fuel rose 6.0% in the 12 months to September 2026, the most since April 2022. Leave out computers and semiconductors as well and they rose 3.9%, on an index the Bureau of Labor Statistics also publishes. Import prices of computers, peripherals and semiconductors rose 22.9%, the largest 12-month rise in a series that begins in December 1984, and each monthly reading from February to September set a new high. Capital goods, the group they belong to, rose 8.4%, matching March 1988. All of these are prices before duty.
Outside fuel, prices rose 6.0%. Without computers and chips, 3.9%
The Bureau of Labor Statistics reported on 16 October that prices of goods imported into the United States rose 1.1% in September and 8.1% over 12 months, “the largest 12-month advance since the index increased 8.8 percent for the year ended July 2022”. Fuel rose 34.5%. Everything else, the nonfuel index, rose 6.0%. Our weekly of 19 October reported those figures.
These are what American importers paid foreign sellers, before any duty. “Import prices are based on U.S. dollar prices paid by the U.S. importer,” the release’s technical note says, and most are quoted free on board at the foreign port. “The prices for the items used to calculate the Import/Export Price Indexes exclude duties,” BLS says. A tariff is paid on top.
Of the 285 twelve-month changes in the nonfuel series, which starts in December 2001, 13 were larger than 6.0%, all of them in 2008, 2021 or 2022. The index has not fallen in any month since August 2025, although October 2025 is missing: “Some Oct and Nov 2025 data values are not available due to the 2025 lapse in appropriations”. In the year to September 2025 it rose 0.3%.
BLS also publishes an index of all imports except computers, semiconductors and fuel. It rose 3.9%, the most since August 2022, when it rose 4.0%, and against 0.2% a year earlier. That is 2.1 points below the nonfuel figure. The release’s end-use table gives no weight for computers and semiconductors, so this piece does not estimate how many of the 6.0 points they supplied; the two indexes are the comparison BLS itself offers.
Computers, peripherals and chips rose 22.9%, the most in data from 1984
Import prices of computers, peripherals and semiconductors rose 22.9% in the year to September, the largest 12-month increase in a series that begins in December 1984. Each of the eight readings published from February to September 2026 set a new high: 7.2%, 8.3%, 10.0%, 13.8%, 15.3%, 17.8%, 19.5% and 22.9%. Before February, the highest had been 6.3%, in September 1988.
That index’s earlier highs did not last. A year after September 1988, import prices of computers, peripherals and semiconductors were 1.6% lower than a year before; their 2022 peak, 4.4% in May, had turned into a fall by March 2023. Of the index’s 408 twelve-month changes before 2026, 350 were falls.
Within the category, computer accessories, peripherals and parts rose 49.9% and semiconductors 15.8%. Capital goods, the group they belong to, rose 8.4%. That matches March 1988 and is higher than any month since, as BLS’s own table of historical references also records. Without computers, peripherals and semiconductors, capital goods rose 1.8%.
Consumer goods, vehicles and food moved far less. Consumer goods other than vehicles rose 2.7%, matching May 2022 and more than in any month since; vehicles, parts and engines 1.1%; foods, feeds and beverages 2.9%. Metals rose more: unfinished metals by 25.3% and finished metals by 18.5%.
How the effects travel
The map traces what this price rise changes, for whom and how soon. Solid lines are measured in the data, dashed lines rest on a stated assumption and dotted lines are untested.
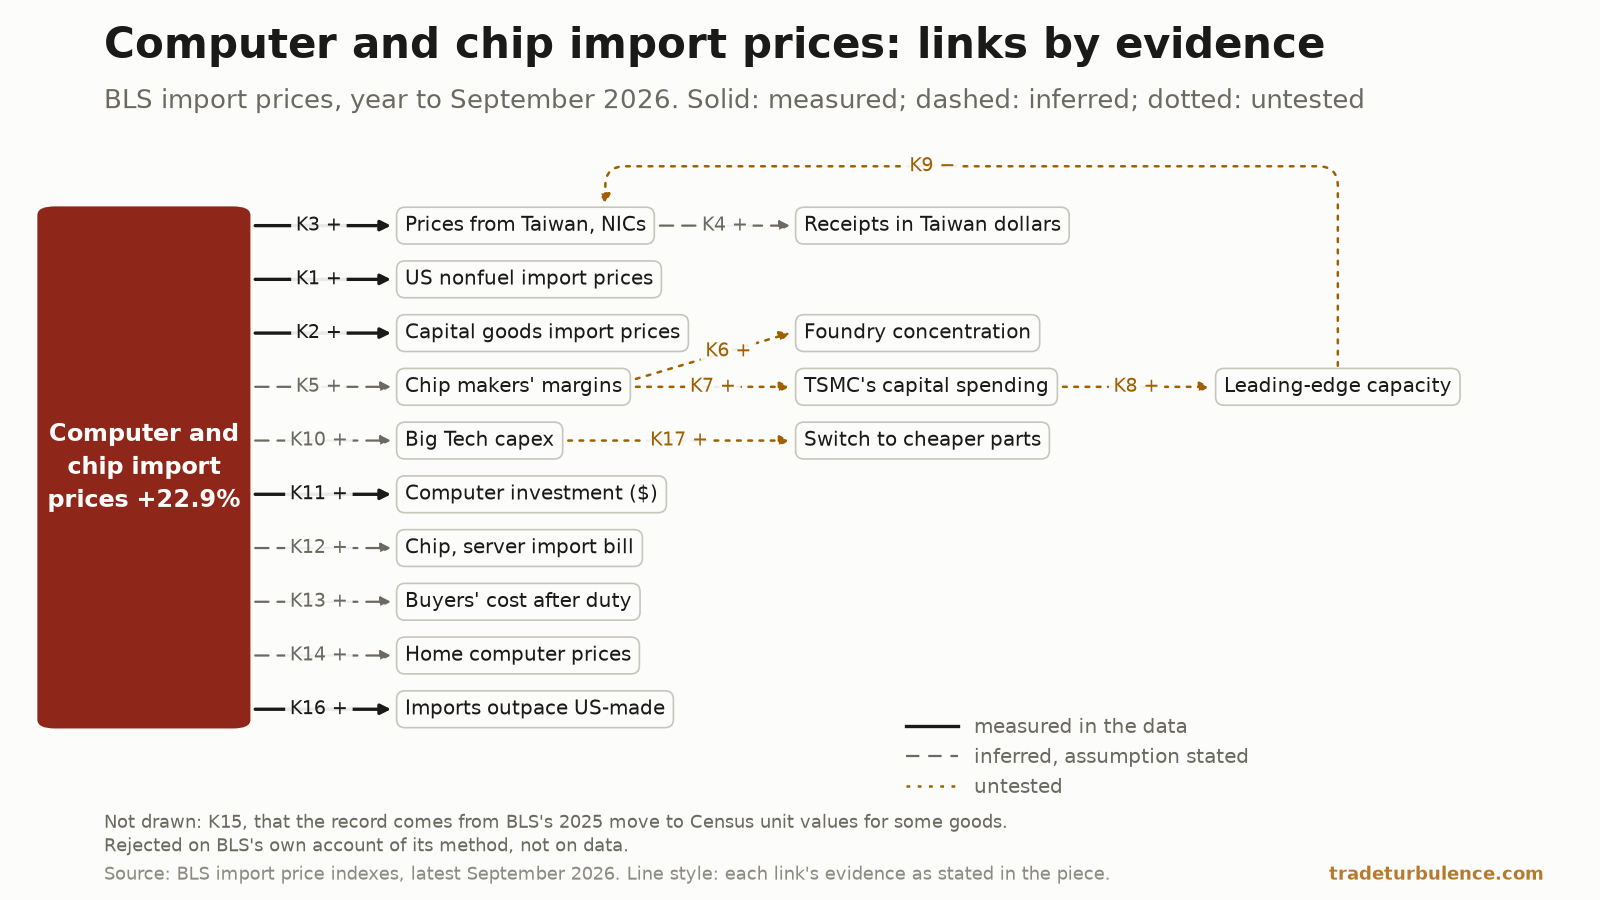
The first effects are in the measures themselves. The category sits inside the nonfuel and capital goods indexes: the first rose 6.0% with it and 3.9% without it, and the second rose 8.4%. By origin, the rise is largest on goods from the four Asian newly industrialised economies, Taiwan among them: their semiconductors and other electronic components rose 46.0%, against 4.0% from ASEAN.
Then the money. TSMC took in 50.9% more Taiwan dollars in July to September than a year earlier, and, as our 21 October piece found from its management report, its dollar revenue per wafer shipped rose 28.8%. By the same report, its gross margin was 66.4%, against 59.5% a year earlier. Tying the revenue per wafer to the US index assumes the two price the same chips. On the buyers’ side, Microsoft, Alphabet, Amazon and Meta spent 87.0% more on property and equipment in the second quarter than a year earlier, and over the 12 months to August the value of server imports rose 146.1% and that of integrated circuits 26.3%. Reading part of those rises as price assumes the purchases are priced like BLS’s index; neither the filings nor the trade figures split price from volume. For business investment in computers, BEA does split them: in the year to the second quarter it rose 59.5% in current dollars and 43.3% in real terms, and BEA’s price index for it rose 11.4%.
Households pay more for computers too. The consumer price index for computers, peripherals and smart home assistants rose 9.7% in the year to September, the largest 12-month rise in a series that begins in December 1997. How much of that follows import prices is not shown; the link assumes retail prices follow, in part, what importers pay.
Taiwan’s exporters may have gained twice. Their dollar prices rose 8.8% while the Taiwan dollar fell 4.3% against the US dollar, so each unit brought 13.7% more Taiwan dollars, if invoiced in dollars, as all but about 6% of BLS’s surveyed items are.
The second-order effects are untested. TSMC reiterated, unchanged, a 2026 capital budget of US$60bn to US$64bn, which its chief financial officer tied to customers’ demand on the 15 October call; whether higher margins add to it is not shown. If that spending adds leading-edge capacity, the rise would slow and could reverse; after the 1988 and 2022 highs the index did fall, for reasons this data does not show. Buyers moving to cheaper parts would cool it sooner. Whether higher margins let TSMC keep or widen its share of foundry supply is not tested.
Two checks on the record itself. By BLS’s account it is not a product of the bureau’s 2025 move to pricing some goods from Census unit values: “Goods categories that are heterogeneous in nature—such as capital goods and technology-related goods—will continue to require collection with the International Price Survey”, which “attempts to hold the quality of items being priced constant”. That does not rule out quality adjustment lagging fast-changing products. And on matched industries, import prices rose more than US makers’ prices: 36.1% against 26.0% for semiconductors and other electronic components, and 15.8% against a 2.2% fall for semiconductor devices alone. BLS marks the US makers’ figures for June to September preliminary.
Taiwan’s machinery and electrical goods paid 0.80% and 3.32% in duty
For goods from Taiwan, little of the buyers’ bill is duty. Machinery (HS 84) and electrical equipment (HS 85) make up 90.4% of imports from Taiwan and were charged 0.80% and 3.32% over the 12 months to August, so the before-duty rise reaches buyers nearly whole, if those rates stand for the goods in BLS’s index.
Proclamation 11002 of 14 January imposed a tariff on chips after the Secretary of Commerce recommended “immediately imposing a 25 percent ad valorem tariff on a very narrow category of semiconductors”, which would “not apply when the chips are imported to support the buildout of the United States technology supply chain”. It asked for an update “By July 1, 2026” on chips used in US data centres, “so that the President may determine whether it is appropriate to modify the tariff”. A search of the Federal Register on 23 October found no later proclamation modifying it.
Who bears a tariff needs the price after duty, which this data does not have. Gita Gopinath and Brent Neiman, in an NBER working paper on the 2018–19 and 2025 tariffs, write that “tariff pass-through to U.S. import prices is almost 100 percent, so the United States is bearing a large share of the costs”. The NBER’s summary says the actual 2025 tariffs “passed through almost entirely to the tariff-inclusive price of imports”, and puts 2018–19 at 80%. Their work does not cover the year to September 2026, and nothing here tests it.
Our weekly set the release beside the site’s effective tariff rate, customs duties deposited at the Treasury over 91 days divided by goods imports, and said “we have not tested how the two relate”. That rate went from 11.34% at the end of September 2025 to 7.84% a year later, while nonfuel import prices rose 6.0%. One year of two series moving apart is a single observation; it cannot show how they relate.
Among the nine single origins, prices rose most from Canada and Taiwan
BLS’s table 7 breaks import prices down by where the goods come from. Its origin indexes cover all goods, fuel and mining included, so they do not compare with the nonfuel 6.0%. Nine origins are a single country or the European Union; the rest are regional groups, and “Regions are not mutually exclusive”. Two groups rose more than Taiwan: Asia Near East by 14.2% and the newly industrialised economies by 12.5%.
| Origin | Import prices, Sep 2025 to Sep 2026 | US duty over all imports, 12 months to Aug 2026 | US duty over dutiable imports | Imports entering duty-free |
|---|---|---|---|---|
| Canada | +16.1% | 3.2% | 19.2% | 83.2% |
| Taiwan | +8.8% | 3.0% | 19.5% | 84.8% |
| Germany | +5.8% | 9.8% | 15.0% | 34.7% |
| United Kingdom | +3.8% | 6.2% | 11.8% | 46.9% |
| European Union | +3.7% | 7.8% | 14.6% | 46.5% |
| Mexico | +3.3% | 3.7% | 20.3% | 81.7% |
| China | +3.1% | 27.6% | 31.9% | 13.4% |
| Japan | +1.1% | 12.2% | 15.3% | 20.6% |
| France | +0.2% | 5.8% | 13.7% | 57.5% |
Import prices are BLS indexes, not seasonally adjusted; Germany and France are inside the EU figure. The duty rates are the US Census Bureau’s calculated duty over imports for consumption, as on this site’s tariff pages; the Census Bureau publishes September on 4 November.
About half of Canada’s rise came from goods that are not manufactured. Its nonmanufactured goods, from farms, forests, fisheries, mines and oil and gas fields, rose 29.0% and supplied about 8.5 of the 16.1 points. That split is our own arithmetic, BLS’s weights rolled back to September 2025; BLS publishes none. Mining, oil and gas extraction alone rose 32.0%. Its manufactured goods rose 10.6%, with refinery and coke-oven products up 69.0% and primary metals up 26.4%. BLS gives Taiwan no industry breakdown; machinery and electrical equipment are 90.4% of its goods.
On duty over all their imports, Canada and Taiwan are charged the least of the nine, because 83.2% and 84.8% of their goods pay none. On the goods that do pay, they are charged 19.2% and 19.5%, the fourth and third highest of the nine, after China and Mexico. Ranked against the all-imports rate, the price rises run the other way: −0.82 on seven origins, with the EU counted once. That rests on two points. Without Canada and Taiwan, the other six (Germany and France counted separately) give −0.03; against the rate on dutiable imports it is −0.21 on seven and +0.12 on eight. Within one industry the order changes: for machinery, China’s prices rose 5.3%, the most of seven origins, and the ranking against the all-imports rate turns positive, at +0.37 on six; for electrical equipment China’s fell 7.1%. Nothing in this data measures a tariff effect on these prices.
The dollar moved less than 1%
A weaker dollar raises the dollar price of imports with no tariff involved. The Federal Reserve’s broad dollar index averaged 120.03 in September 2025 and 119.22 in September 2026, a fall of 0.7%. Measured at month-ends it rose 0.7%. Passed through in full, a move that size would add less than a point to a 6.0% rise.
Against single currencies the dollar moved more, and not in the way a currency explanation would need. Only two of the seven origins’ currencies gained on the dollar, the yuan by 6.2% and the Mexican peso by 7.0%, and prices from China and Mexico rose little. The Taiwan dollar fell 4.3% and the Canadian dollar 1.0%, and prices from Taiwan and Canada rose most. The yen fell 5.5% and prices from Japan rose 1.1%.
The Stress Index (v3) read 81.6, Severe, on 21 October; its trade-policy pillar read 99.3.
What this cannot settle
Import prices leave out the tariff. They show what importers paid foreign sellers, not what the goods cost once duty was added.
How much of the 6.0% computers and chips supplied. The release’s end-use table gives no weight for the category, so the piece compares BLS’s two indexes, 6.0% and 3.9%, and stops there.
Price against volume. The links from this rise to the four companies' spending and to the import bill assume those purchases are priced like BLS’s index; neither the filings nor the trade figures split price from volume.
How much reaches households. The consumer price index for computers rose 9.7%, but the data does not show how much of that follows import prices.
The origin comparison rests on two points. The inverse ordering with the all-imports rate is −0.82 on seven origins, −0.57 on eight, −0.03 without Canada and Taiwan, and −0.21 or +0.12 on the rate on dutiable imports. It does not show a cause.
These are first prints. BLS may revise September’s indexes in each of the next three releases, and October 2025 is missing.
What to watch
4 November, 8:30 a.m. in Washington. The Census Bureau publishes September’s trade, the next month on the tariffs pages and of chip and server imports. September 2025, when the rate on China was 37.58%, leaves the 12-month window; the only higher month in the window was October 2025, at 37.82%.
17 November. BLS publishes October’s import prices. Its file has no October 2025 index for nonfuel prices or for computers and semiconductors, so there is no October-on-October change to compare with. A monthly fall in nonfuel prices would end the run of no declines since August 2025.
17 December. November’s import prices. An index for computers, peripherals and semiconductors of 59.4 or more, against 59.0 in September, would put its 12-month rise at 23.0% or more: a ninth published reading in a row to set a high. Held at 59.0, the rise would be 22.2%, and the run would end. A nonfuel index of 140.0 or more, against 137.6, would put its rise at 7.3% or more, above every reading since March 2022; below 138.3 it would drop under 6.0%.