The 10-year rose 1.34 points. The real yield was 1.23 of them
The US 10-year yield reached 5.31% on 5 October 2026, its highest since May 2002. Of its 1.34-point rise from 27 February, 1.23 points was the real yield.
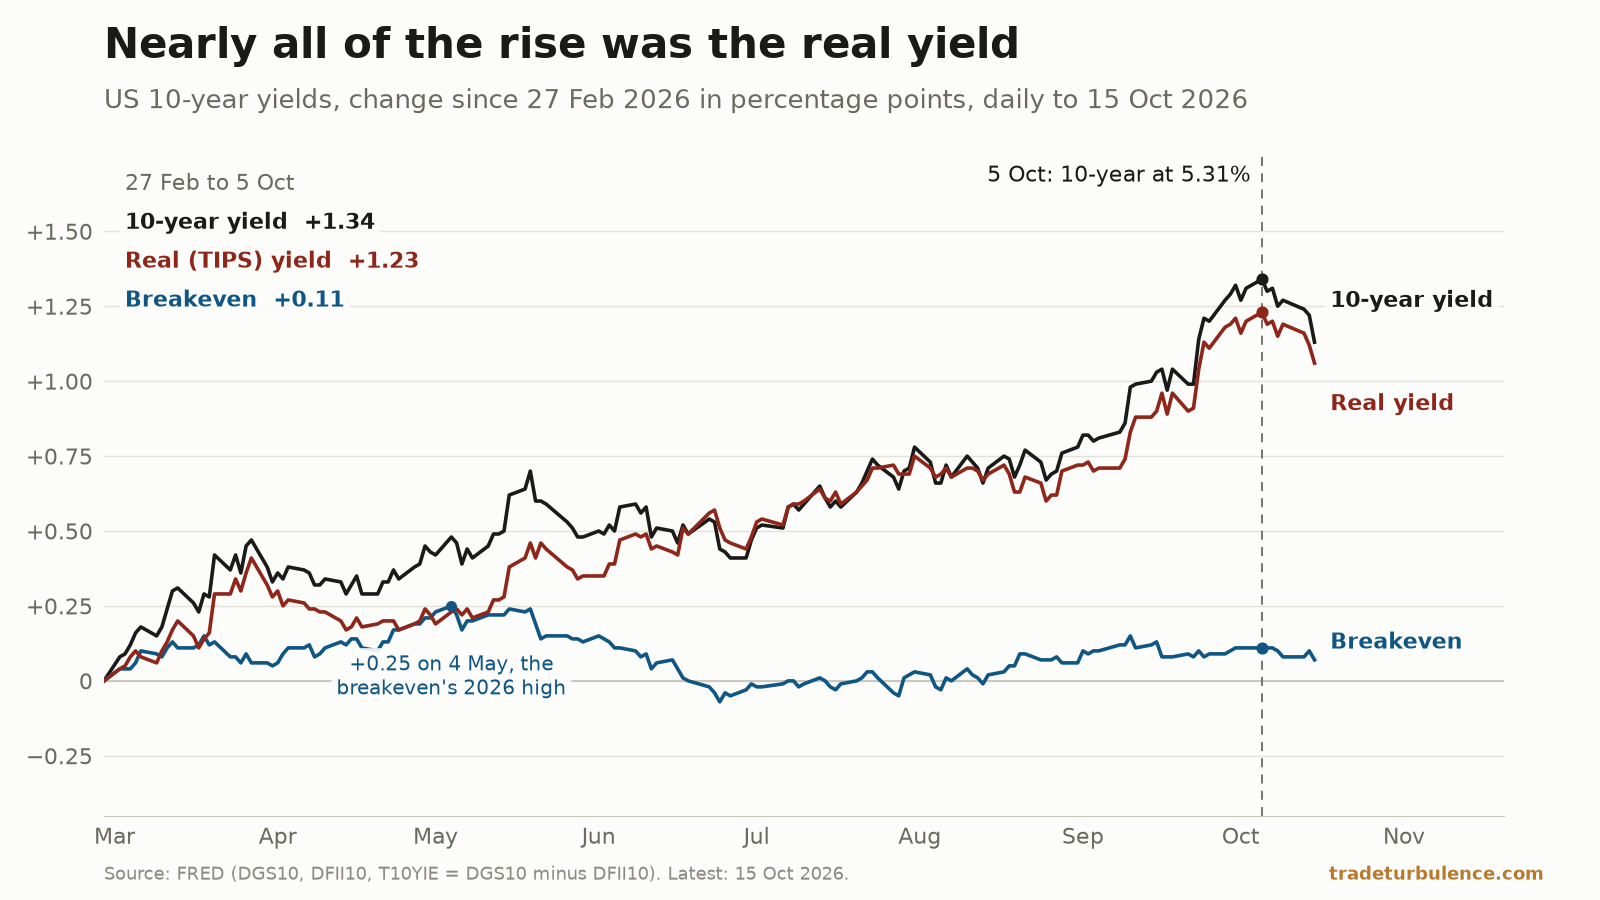
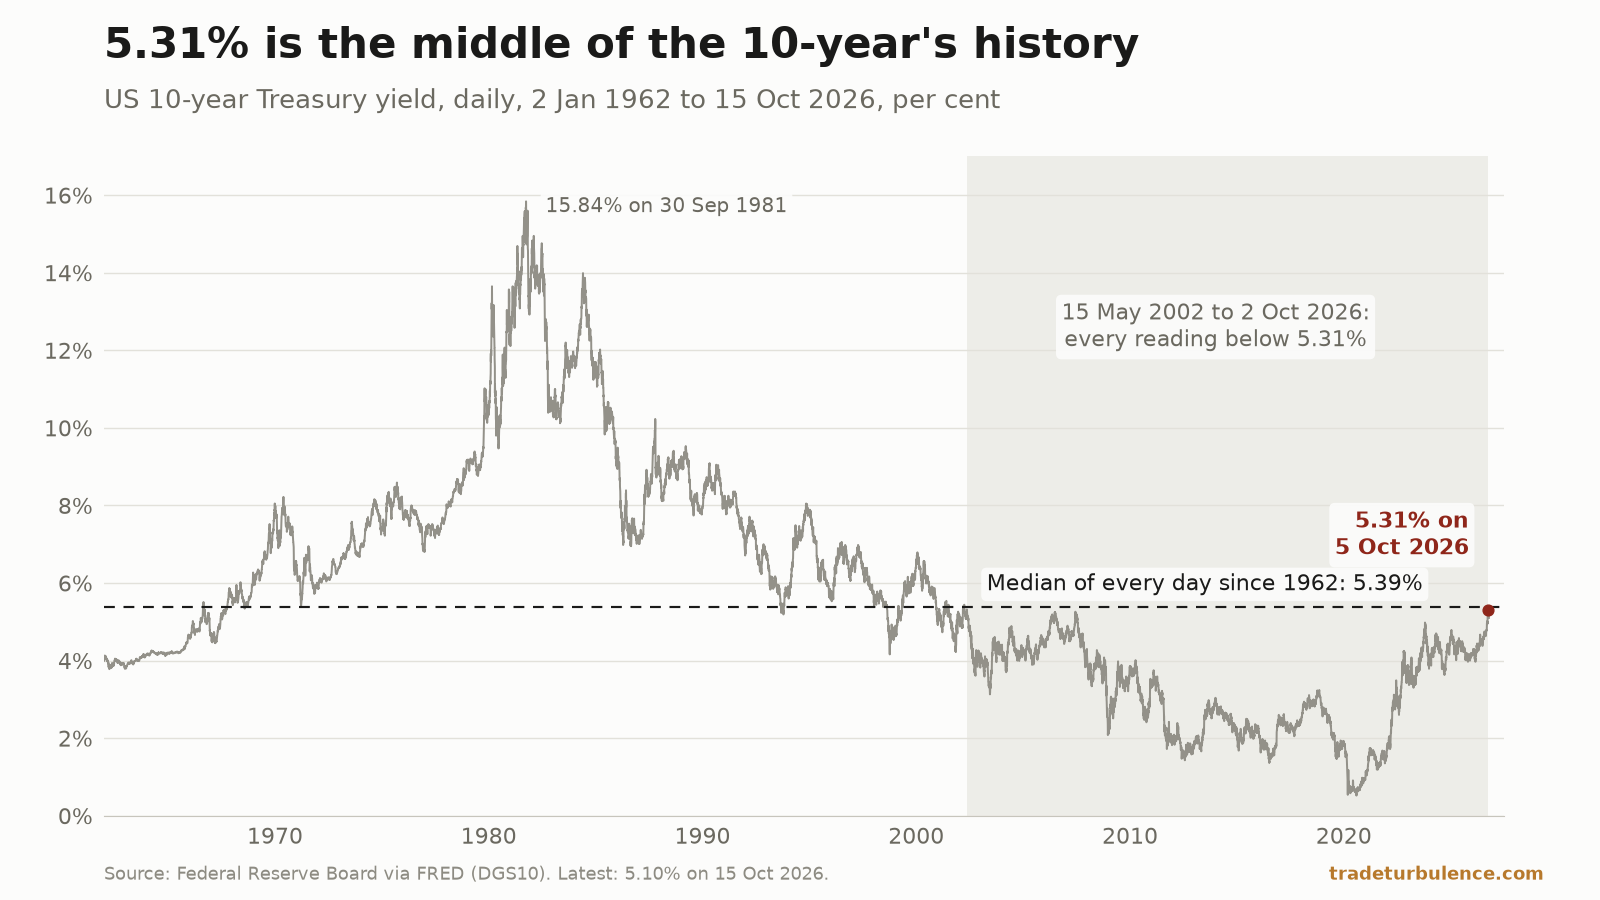
The US Treasury’s 10-year yield was 5.31% on 5 October 2026, its highest daily reading since 14 May 2002 and 1.34 points above its 2026 low of 3.97% on 27 February. Over the same dates the 10-year inflation-protected yield, the real yield, rose 1.23 points to 2.95%, its highest since November 2008; the breakeven between the two rose 0.11. The Federal Reserve staff’s own fitted curves put an even larger share of the rise in the real yield. Against its own record, 5.31% is the middle: just over half of all daily readings since 1962 were higher.
Of the 1.34-point rise, 1.23 points was the real yield
The 10-year is the Treasury’s constant-maturity yield, published daily on FRED as DGS10 from January 1962; it was 5.10% on 15 October. The real yield is the 10-year inflation-protected (TIPS) yield, DFII10, from January 2003: TIPS yields, the Fed’s staff note, “are often thought of as “real yields.”” The gap between the two is the breakeven, which FRED publishes as T10YIE and describes as “derived from” the two yields.
So the three add up by construction, and they do, to the hundredth, on all 5,951 days since 2003 on which all three are published. On 27 February, 3.97 = 1.72 + 2.25; on 5 October, 5.31 = 2.95 + 2.36. The rise splits with nothing left over: 1.23 points of real yield and 0.11 of breakeven, 91.8% and 8.2% on our arithmetic. That is accounting, not a model: it says where the rise sits, not what caused it.
The unusual number is the real yield. At 2.95% it was higher than on any day since 24 November 2008; only 15 of the 5,951 days were higher, all in October and November 2008. From 2009 to 2025 it never rose above 2.52%, and its median since 2003 is 1.07%. The breakeven’s 2.36% was above 73.2% of days since 2003 and well below its record of 3.02% in April 2022.
The Fed Board’s staff fit their own daily nominal and TIPS curves, with data to 9 October. On their 10-year zero-coupon yields, from 27 February to 5 October the nominal yield rose 1.27 points, the real yield 1.26 and inflation compensation 0.01: 99.1% real on our arithmetic. On their par yields, which do not add exactly, the real yield is 1.27 of 1.31 points, 97.0%, with 0.03 unassigned. The Fed calls these files “a staff research product and not an official statistical release”.
The breakeven rose in the spring, then fell back
The rise came in two legs. From 27 February to 4 May the 10-year rose 0.48 points, to 4.45%; the real yield added 0.23 and the breakeven 0.25, taking the breakeven to 2.50%, its high for 2026. From 4 May to 5 October the 10-year rose another 0.86 points while the real yield rose 1.00 and the breakeven fell 0.14. On the way it dropped below its 27 February level on 20 days between 22 June and 13 August, to a low of 2.18% on 24 June. The Fed staff’s fitted curves show the same two legs.
The 2-year rose more, and the Fed raised its rate in September
The 2-year yield (DGS2) rose 1.46 points over the same dates, from 3.38% to 4.84%, and reached 4.92% on 28 September, its highest since 30 May 2024. The 10-year minus 2-year spread narrowed from 0.59 to 0.47 points; at 0.35 on 16 October it was at the 62nd percentile of its past five years.
On 16 September the Federal Open Market Committee “decided to raise the target range for the federal funds rate by 1/4 percentage point to 3-3/4 to 4 percent”, by 12 votes to none. Its statement said: “Inflation remains elevated. Today’s policy action will support a timelier return to the Committee’s 2 percent goal.” The effective federal funds rate rose from 3.63% to 3.88% the next day, its first step of 2026, after three steps down in September, October and December 2025. The statement explains the decision, not bond yields; why the 10-year rose is not in these series.
Two Fed models split the same rise differently
A breakeven is a market price, not a survey. The Fed staff’s TIPS data file warns that breakeven rates “incorporate inflation risk premiums and the effects of the differential liquidity of TIPS and nominal securities. Consequently breakeven rates should not be interpreted as estimates of inflation expectations.” FRED’s note calls T10YIE “a measure of expected inflation”. Two Fed models try to separate expectations from premiums.
The Board’s Kim-Wright model, which “can be used to extract market expectations of the future path of the short rate, term premiums in bond yields”, put the 10-year term premium at 1.10 points on 5 October, its highest since April 2010, up from 0.46 on 27 February. Of its fitted 1.24-point rise, 0.63 was term premium and 0.60 the expected path of short rates, on our subtraction: a different cut from the real-and-breakeven split, not a check on it.
The Cleveland Fed’s model, built from “Treasury yields, inflation data, inflation swaps, and survey-based measures of inflation expectations”, puts more into inflation. From its February to its October 2026 estimate, its 10-year expected inflation rose 0.36 points, to 2.73%, and its 10-year real interest rate 0.73, to 2.47%, the highest since July 2006: about a third to inflation, on our ratio. On this model expected inflation rose; in market prices, inflation compensation barely moved. Neither settles which is right.
At 5.31%, the 10-year sits at the middle of its own history
“Highest since 2002” describes the past 24 years, not the past 64. Of the 16,182 daily readings since 2 January 1962, 8,171 were higher than 5.31% and 8,002 lower; the median is 5.39%. At 5.10% on 15 October, 52.7% of readings were higher. Both sit above the medians of 1962–69 (4.51%), the 2000s (4.41%), the 2010s (2.35%) and 2020–26 (3.81%), and below those of the 1970s (7.49%), 1980s (10.46%) and 1990s (6.53%). What was unusual is the stretch behind it: 6,101 consecutive readings below 5.31%, from 15 May 2002 to 2 October 2026. On the five-year window the site’s indicator pages use, 5 October was the highest of the 1,260 readings to that day. The window decides whether 5.31% looks extreme.
In July we made the same point about the 30-year: at 5.16% on 24 July it sat below its median since 1977 of 5.44%, with 46.4% of days lower, figures that re-derive unchanged on the data as fetched on 19 October. Since then the 30-year reached 5.67% on 7 October, its highest since 5 July 2002; on 15 October it was 5.43%, at its median of 5.42%. From 27 July to 5 October the 10-year rose 0.66 points, 0.51 of them real yield and 0.15 breakeven.
Two of the July piece’s three markers had not been crossed by mid-October, and the third was not crossed while it could be measured. The 10-year minus 2-year spread stayed positive from 27 July to 16 October, no lower than 0.20. Weekly jobless claims had not returned above 220,000 by the week to 10 October; the high since was 212,000, in the week to 8 August. The Stress Index threshold of 60 was set on the index’s old version (v2), whose archive runs to 17 August; after 28 July it peaked at 54.0, on 4 August, and it left its Normal band downward, reading 38.4 (Settled) on 12 August. The index has since been rebuilt on a different scale (v3), so the test stops there. On v3 it read 81.4 on 15 October, in its Severe band, above every day of 2010–2019.
In September, 10-year yields rose in all 18 of the site’s economies with a figure for the month
The site’s economy pages carry the OECD’s monthly long-term government bond yields, published on FRED, for 26 economies; the US page shows the daily 10-year instead. With the OECD’s US series that makes 27. Of the 18 with a September figure as of 19 October, all 18 rose from August, and 26 of the 27 were higher in their latest month than in February 2026, Hungary the exception. These are monthly averages, a different measure from a daily high: the US’s September figure, 4.99%, matches our average of September’s daily readings.
For 11 of the 27, the latest figure is higher than in any month since 2011 or earlier:
| Economy | Latest (OECD, monthly) | Last month higher | Series from |
|---|---|---|---|
| Japan | 3.05%, Sep 2026 | Aug 1996 (3.21%) | 1989 |
| United Kingdom | 5.24%, Sep | Jul 2007 (5.41%) | 1960 |
| United States | 4.99%, Sep | Jul 2007 (5.00%) | 1953 |
| France | 4.48%, Sep | Jul 2008 (4.69%) | 1960 |
| Norway | 4.41%, Sep | Sep 2008 (4.49%) | 1985 |
| Germany | 3.470%, Sep | Jun 2009 (3.474%) | 1956 |
| South Korea | 4.45%, Sep | Apr 2011 (4.48%) | 2000 |
| Sweden | 3.19%, Sep | Apr 2011 (3.30%) | 1986 |
| Luxembourg | 3.40%, Aug | Apr 2011 (3.575%) | 1993 |
| Australia | 5.28%, Sep | May 2011 (5.325%) | 1969 |
| Netherlands | 3.29%, Aug | May 2011 (3.40%) | 1959 |
Japan stands out: 3.05% is its highest since August 1996, in a series from 1989, and far above that series’ median of 1.35%. For the other ten in the table, “highest since” reaches back to 2007–11, not to the top of their own history. Across all 27, 19 are below the median of their full series: the UK’s 5.24% against 6.34% since 1960, Germany’s 3.47% against 6.10% since 1956. A rise in step is in the data; why is not.
What this cannot settle
The split says where the rise sits, not why. The breakeven on FRED is the 10-year minus the TIPS yield, so the shares add up by construction. Why real yields rose is not in these series; the only reason on the record here is the Fed’s, for its own decision.
A breakeven is not an inflation forecast. It carries inflation risk premiums and a liquidity difference between TIPS and ordinary Treasuries; either can move it with no change in expected inflation, and market prices alone cannot separate them.
The models are estimates, and one disagrees with the market split. The Cleveland Fed’s model puts about a third of its February-to-October change in expected inflation; the breakeven’s share of the 27 February–5 October rise was 8.2%. Kim-Wright splits the rise along a different line, term premium against expected short rates. The Fed’s fitted curves are a staff product that can be revised, and run to 9 October.
These are daily readings and monthly averages. DGS10 has one reading a day; moves within a day are not in it. The OECD figures are monthly averages, and nine of the 27 series ended in August as of 19 October.
Lag. The 10-year and real yields run to 15 October and the breakeven to 16 October; the fitted curves and Kim-Wright to 9 October; the OECD series to September or August.
What to watch
27–28 October. The FOMC’s next meeting, with the target range at 3¾–4% since 16 September.
5.39% on the 10-year. The median of its daily readings since 1962. A reading above it would put the 10-year above the middle of its own history for the first time since 1 April 2002. On 15 October it was 0.29 points below.
2.50% on the breakeven. Its 2026 high, on 4 May; it was 0.15 points below on 16 October. A reading above it would be the breakeven’s highest since 3 March 2023.
3.15% on the real yield. The record in the TIPS series from 2003, set on 21 November 2008; on 15 October the real yield was 0.37 points below.