The surcharge ended in July. The deficit began widening in May.
The US goods deficit reached $136.6bn in August, its widest since March 2025. Of the $53.5bn widening since April, $40.7bn was in the data by July.
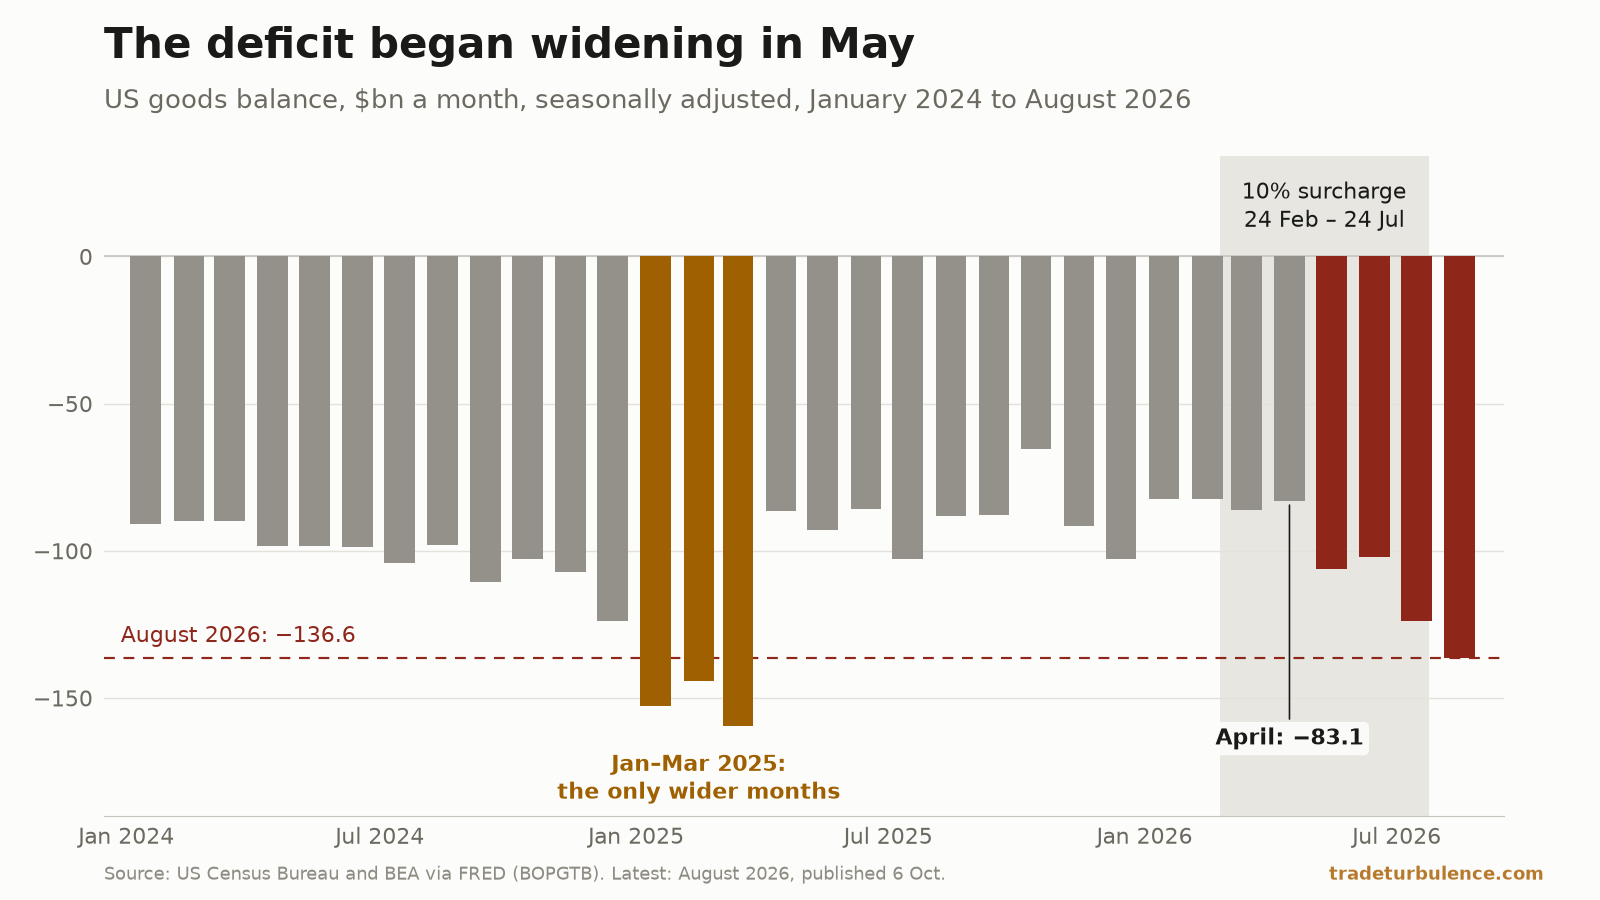
The United States ran a goods deficit of $136.6bn in August 2026, the latest month published. That is the widest since March 2025. It is also wider than any of the six months touched by the 10% import surcharge that ran from 24 February to 24 July. The widening began before the surcharge ended. The deficit was $83.1bn in April; of the $53.5bn by which it has widened since, $40.7bn was in the data by July. Goods imports were $84m short of their March 2025 record in dollars on the balance of payments basis, and 9.9% short of it in volume on the Census basis.
Only three months since 1992 were wider, all of them in early 2025
The figures are from the monthly trade release of the Census Bureau and the Bureau of Economic Analysis, published on 6 October, and the same series on FRED back to January 1992: seasonally adjusted, on the balance of payments basis, in dollars of the day. August’s figures are a first print.
Of the 416 months in that series, August’s $136.6bn is the fourth widest. The three wider are January, February and March 2025, at $152.8bn, $144.3bn and $159.5bn. Outside that quarter the widest month had been December 2024, at $124.0bn; August is $12.6bn beyond it. The six months the surcharge touched ranged from $82.5bn in February to $123.8bn in July.
The goods-and-services deficit, $105.6bn, also ranks fourth of the 416 months, behind the same three.
The rank does not hang on the first print. July’s goods deficit was revised from $119.6bn to $123.8bn in the 6 October release; a revision that size the other way would leave August at $132.4bn, still fourth.
One comparison still runs the other way. Over January to August the goods deficit is $802.6bn, against $912.3bn in the same months of 2025. All of that difference is the first quarter: from April to August the 2026 deficit is $95.8bn wider than a year earlier.
Three-quarters of the widening was in the data by July
The surcharge was a 10% duty on imports, proclaimed on 20 February under Section 122 of the Trade Act of 1974 “to deal with the United States’ large and serious balance-of-payments deficit”. It applied from 12:01 a.m. eastern time on 24 February until 12:01 a.m. on 24 July, 150 days.
| 2026 | Goods deficit | Days under the surcharge |
|---|---|---|
| January | $82.3bn | none |
| February | $82.5bn | 5 of 28 |
| March | $86.1bn | all |
| April | $83.1bn | all |
| May | $106.3bn | all |
| June | $102.0bn | all |
| July | $123.8bn | 23 of 31 |
| August | $136.6bn | none |
Goods balance, seasonally adjusted, balance of payments basis; days counted from the proclamation’s start and end.
From January to April the deficit sat between $82.3bn and $86.1bn. May stepped out of that band, $23.2bn wider than April. June gave back $4.3bn, July added $21.8bn and August $12.8bn.
Measured from April, the widening is $53.5bn. In dollars of the day that is the largest widening among the 412 four-month changes since 1992, ahead of the $52.4bn between November 2024 and March 2025. Of it, $40.7bn, or 76%, had happened by July.
Until July the widening was as much exports as imports. Between April and July goods imports rose $20.0bn and goods exports fell $20.8bn; in August imports rose $17.2bn and exports rose $4.4bn. Outside petroleum, the release’s exhibit 9 has the deficit growing from $84.4bn in January to $128.4bn in July, wider than the month before in every month but June. A petroleum surplus that rose from $4.1bn in February to $17.8bn in April kept that out of the total at first.
Our 14 August piece reported that the twelve-month goods deficit had bottomed in April and widened in May and June. July and August widened it again: from $1,050.5bn in April, its narrowest since September 2021, to $1,149.9bn in August, the widest since January 2026. Our 27 July piece asked whether exports would recover after May’s fall. Exports of goods and services fell again in June and in July, then rose $4.5bn in August, to $315.2bn against April’s $329.9bn. That piece also said of the goods-and-services deficit: “If it holds near $77bn, something structural changed”. In the 6 October release it was $75.8bn in May, $71.2bn in June, $92.8bn in July and $105.6bn in August. That span is too short to show whether the change is structural.
Imports are 1.2% below their record in dollars and 9.9% below it in volume
On the balance of payments basis, goods imports of $342.2bn in August are the second highest in the series. The record is March 2025’s $342,316m; August was $342,232m, $84m less.
That near-tie belongs to one accounting basis. Balance of payments imports are the Census Bureau’s customs data plus net adjustments the BEA makes, among other reasons, “to supplement coverage of the Census data”. Those adjustments were $6.2bn in August against $2.2bn in March 2025. On the Census basis August’s imports were $336.0bn, $4.1bn or 1.2% below March 2025.
Against the record, prices account for more. The Census Bureau also publishes goods trade in chained 2017 dollars, the series the release calls real, from 1994. On that measure August’s imports were $267.7bn against $297.1bn in March 2025: 9.9% lower, and the fourth highest of 392 months, not the second. The goods deficit in chained dollars, $114.7bn, is likewise the fourth widest of the 392.
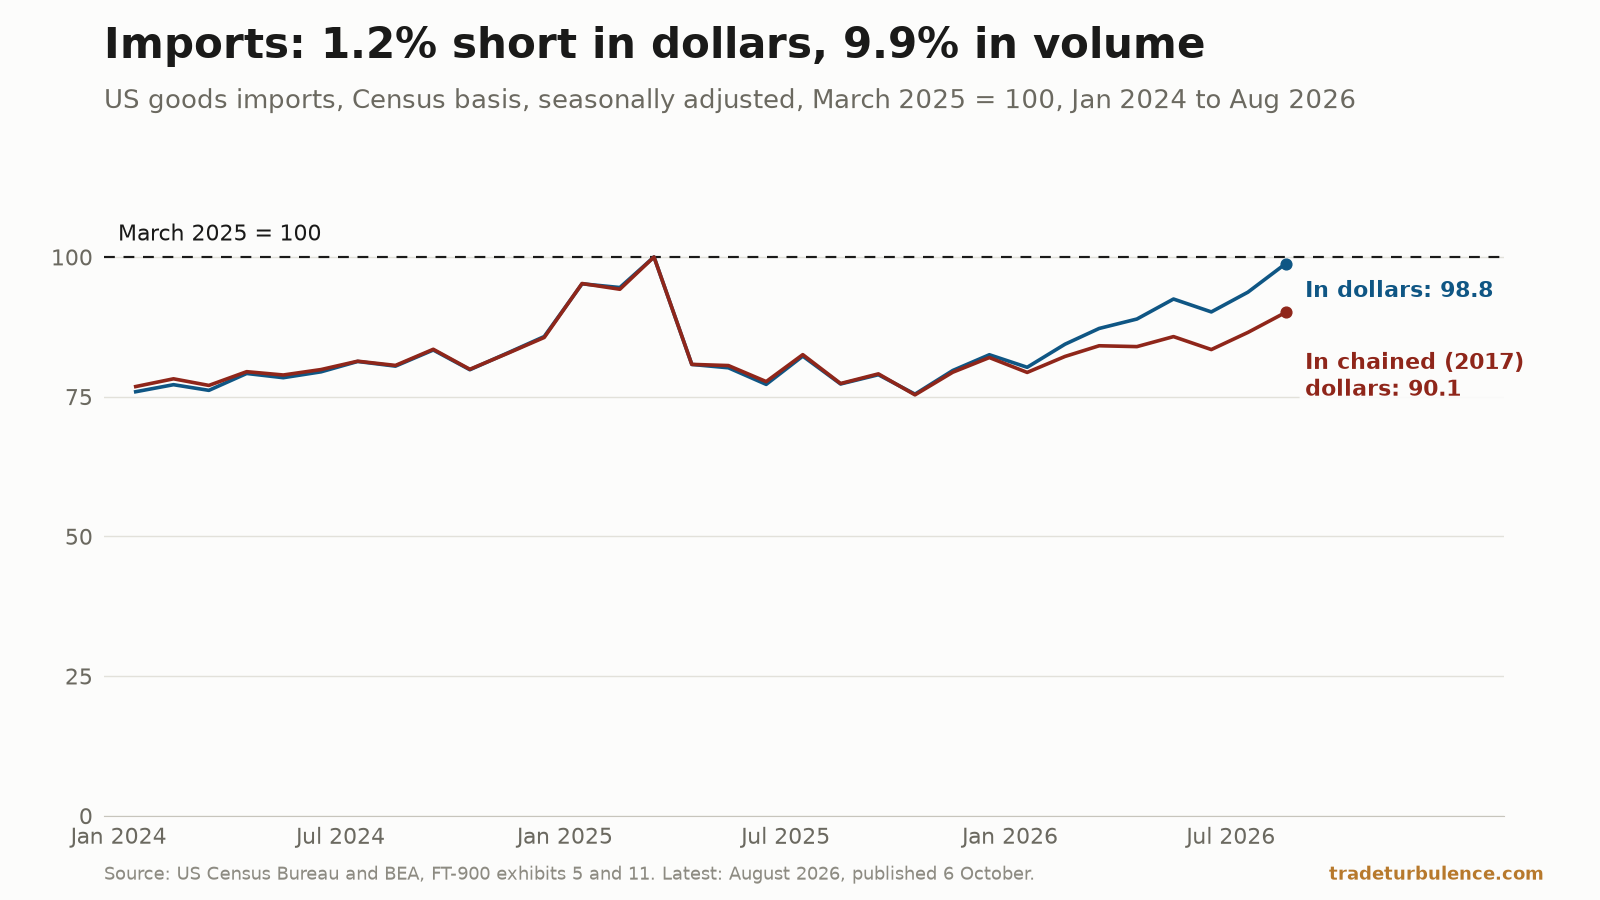
Price is not most of the rise since April, though, and oil is very little of it. The release puts August’s increase in imports at 4.1% in chained dollars against 5.4% in dollars; since April the figures are 7.3% and 11.1%. Petroleum accounts for $1.5bn of the $37.2bn rise in goods imports since April, or 4%. In August crude oil imports, which are not seasonally adjusted, rose 18.6% in barrels while their unit price fell 3.0%, to $76.94 a barrel.
In August alone the largest increase was in industrial supplies, $9.1bn, of which crude oil was $3.3bn and nonmonetary gold $3.1bn. Since April it is capital goods. They are $19.5bn, or 58%, of the $33.7bn rise in Census-basis imports. At $146.4bn they were 43.6% of Census-basis goods imports in August, against 27.4% in March 2025. In chained dollars they are the highest in a series that begins in 1994. Over January to August four lines, computers, computer accessories, semiconductors and telecommunications equipment, rose $273.0bn on the same months of 2025, while every other line together fell $176.1bn. The March 2025 record was a different basket: consumer goods imports were $101.6bn then and $57.5bn in August.
The proclamation exempted “certain electronics”; the release does not show how much of the capital goods total that covered.
In the first full month of Section 301 duties, imports from China and Mexico barely moved
At 12:01 a.m. on 24 July the surcharge gave way to Section 301 duties of 10% or 12.5% on 60 economies. Our August piece named two of the rates to watch: 12.5% on China and 10% on Mexico. In August, the first month the new duties applied throughout, seasonally adjusted imports from China fell $0.2bn and those from Mexico rose $0.4bn.
The site’s effective tariff rate divides the customs duties deposited at the Treasury over 91 days by goods imports over the same days. It is gross of refunds, and the Treasury line it uses includes certain excise taxes and fees.
Our weekly of 12 October reported the release and said of this rate: “We have not tested what the August figures do to it”. They lowered it. Had July’s imports as first published been carried forward, which is what the formula does until a new month is released, the reading for 8 October would be 8.24%. With August’s imports and July’s revision, the reading in the site’s file on 14 October is 7.82%.
The Stress Index (v3) reads 82.8, Severe, on 12 October; its trade-policy pillar, which includes this rate, reads 99.3.
Our August comparison does not survive its own rule
As first published, the 14 August piece’s headline finding was that the deficit ran at “$95.0bn a month” before the surcharge and “$94.3bn” under it, which it called the same rate. It said its before period began in March 2025 “to exclude a first quarter” of record deficits. March 2025 belongs to that quarter, and is the widest month in the series. Re-run on FRED’s figures, last updated on 6 October:
| Before period | Before, a month | March–June 2026, a month | Difference |
|---|---|---|---|
| March 2025 – January 2026, as the piece defined it | $94,987m | $94,354m | $634m narrower |
| April 2025 – January 2026, March 2025 excluded | $88,541m | $94,354m | $5,813m wider |
The first row reproduces the piece to within revisions. The second applies its stated rule. With the first quarter of 2025 left out, the deficit ran $5.8bn a month wider under the surcharge than before it.
That gap is 0.58 of the before period’s standard deviation, on four observations. May and June were wider than the before average; March and April were narrower. The re-run does not show that the surcharge widened the deficit. It does show that the deficit did not run at the same rate.
What this cannot settle
Why the deficit widened. The release reports amounts and gives no cause. The data date the widening to May and put 76% of it before the end of July. They do not show what the surcharge’s end did, or did not do, to August. The Section 301 duties began the minute the surcharge lapsed, so nothing here separates the end of one from the start of the other.
How much of a dollar record is price. Every rank on the balance of payments basis is in dollars of the day. The volume series is on the Census basis only and begins in 1994, and the release says its “previous five months are revised” with the September figures.
What a revision will do. July’s goods imports were revised up $4.4bn a month after they were first published, and all but $49m of that was in the BEA’s adjustments, not the customs data. August’s first revision comes on 4 November.
What to watch
4 November, 8:30 a.m. in Washington. September’s trade data and August’s first revision. A goods deficit above $144.3bn would pass February 2025 into third place; one above $159.5bn would be a record. Goods imports above March 2025’s $342,316m would be a record in dollars; in chained dollars the record is $297.1bn.
$87.9bn. That is September 2025’s goods deficit, the next month to leave the rolling annual window. A September 2026 deficit wider than that widens the rolling total again, for a fifth month running.