Euro-area inflation is 3.8%. Without energy, it is 2.3%
Euro-area inflation was 3.8% in September 2026. Excluding energy it was 2.3%, as in January; transport-fuel prices were the highest in Eurostat data from 1996.
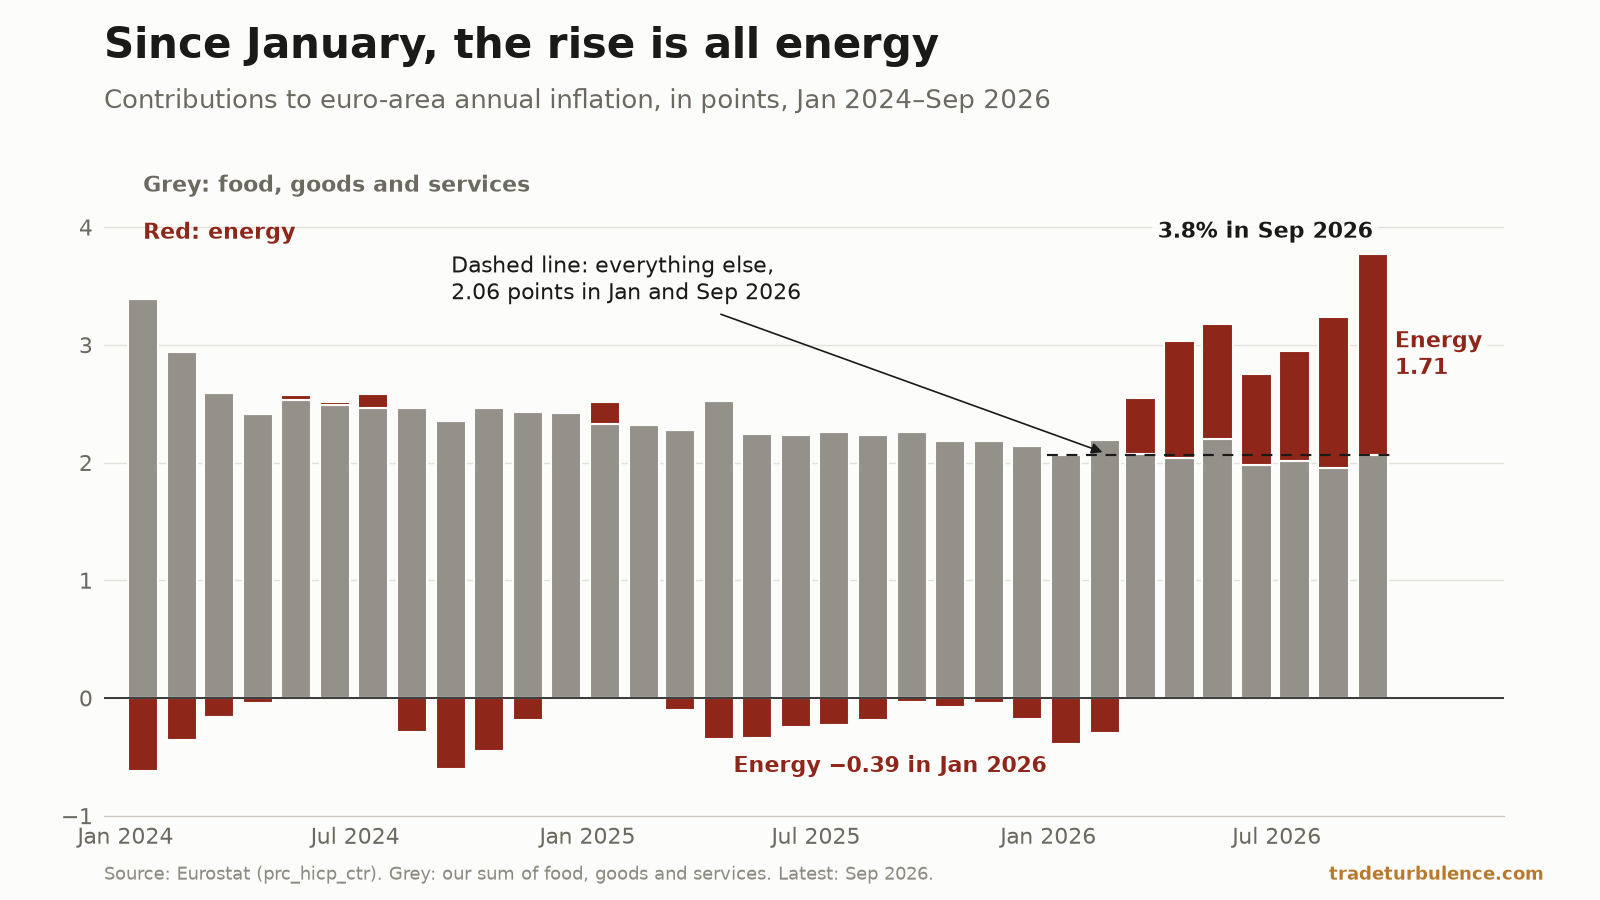
Euro-area inflation was 3.8% in September 2026, Eurostat’s final figure of 16 October shows: up from 1.7% in January, and the highest rate since September 2023 in Eurostat’s monthly series, which starts in 1997. Eurostat’s index excluding energy rose 2.3% on the year, the same rate as in January. In Eurostat’s breakdown, energy contributed 1.71 points to September’s rate, against −0.39 in January. Fuels for personal transport contributed 1.23 points, petrol 0.62 and diesel 0.59 of them, and their price index was the highest in a series from 1996. Gas contributed 0.18 points and electricity 0.13.
Outside energy, the rate was 2.3% in January and in September
Eurostat’s final release for September, published on 16 October, kept the flash estimate of 2 October: 3.8%. August’s rate was 3.2%, revised from a flash of 3.3%; a year earlier, September 2025’s was 2.2%. In Eurostat’s monthly series, which starts in January 1997, the rate was last this high in September 2023, at 4.3%. Of the 356 months from January 1997 to August 2026, 27 were at or above 3.8%, all of them in 2008 and 2021–23.
The same dataset carries a rate for everything in the basket except energy. It was 2.3% in September and 2.3% in January, between 2.1% and 2.4% in every month of 2026, and below the 2.5% of September 2025. Core inflation, which also leaves out food, alcohol and tobacco, was 2.5% after 2.4% in August, inside the 2.2–2.7% it has held in every month since January 2025.
Eurostat also splits the rate into contributions, calculated by a method that makes them add up, “allowing for rounding”. In September energy contributed 1.71 points, services 1.52, non-energy industrial goods 0.29 and food, alcohol and tobacco 0.25. Energy’s 1.71 is 45% of the 3.8 on our arithmetic, and its largest contribution since January 2023. In January it subtracted 0.39 points. Added together (our sum of Eurostat’s three figures), the other three groups contributed 2.06 points in January and 2.06 points in September, and between 1.95 and 2.20 in every month of 2026. Energy’s contribution rose 2.10 points on our subtraction; the headline rate rose 2.1.
That steady total is made of moves that offset. From January, on our subtraction, food, alcohol and tobacco’s contribution fell 0.26 points, non-energy industrial goods’ rose 0.20 and services’ 0.06. Food inflation slowed from 2.6% to 1.3% and non-energy goods inflation rose from 0.4% to 1.1%; services inflation was 3.2% in both months. Core rose from 2.2% to 2.5%.
The last month follows the same pattern. Of the rise from August’s 3.2% to September’s 3.8%, energy’s contribution accounts for 0.42 points; services added 0.09, food 0.03, and non-energy industrial goods took away 0.01 (all our subtractions); the rest is rounding.
In September 2026, transport fuel prices were the highest in Eurostat’s data from 1996
Energy prices were 18.9% higher than a year earlier, revised up from the flash’s 18.8%; the rate was last higher in December 2022. Energy carries a weight of 90.26 per 1,000 in the 2026 basket, and fuels and lubricants for personal transport 38.26 of it. That group contributed 1.23 points of energy’s 1.71; its two largest items, petrol and diesel, contributed 0.62 and 0.59. Diesel prices were 39.8% higher than a year earlier and petrol 27.8%, both the steepest annual rises since June 2022.
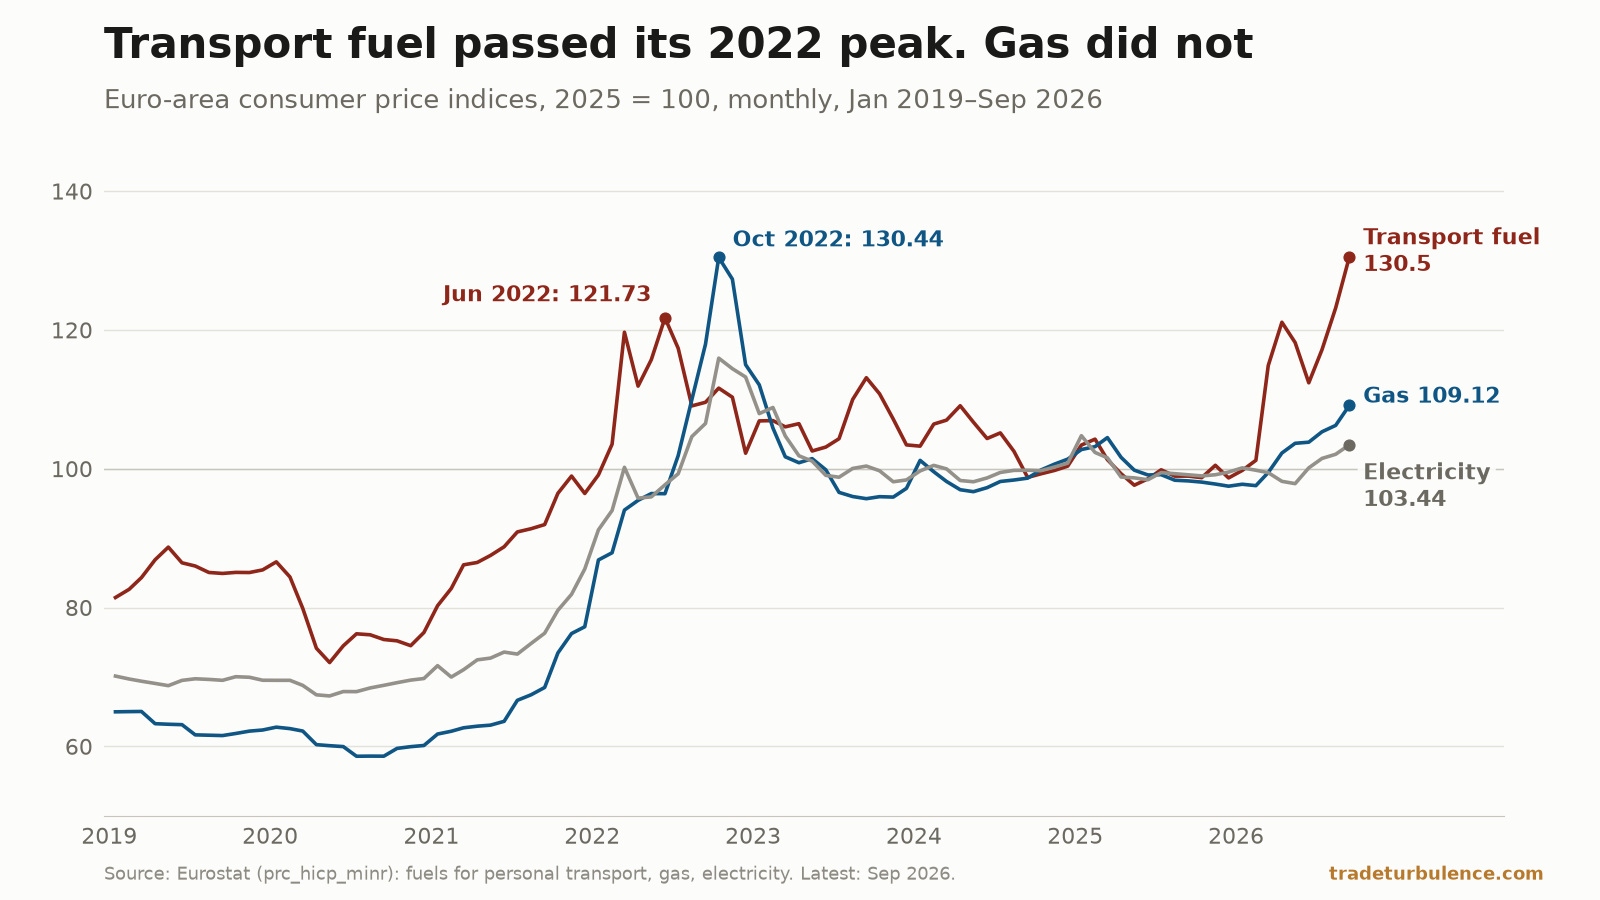
In level terms the group’s price index reached 130.5 (2025 = 100), the highest in Eurostat’s series, which starts in January 1996. It is 6.0% above the previous high, set in August 2026, and 7.2% above June 2022 (both comparisons our calculations from Eurostat’s index). The diesel and petrol indices, which start in December 2016, were at their highs in September too; petrol passed its June 2022 level for the first time in September. Liquid fuels, which Eurostat counts in the housing group, rose 57.3% on the year; their index was also the highest in its series from 1996. The energy index as a whole stood at 117.57; in its series from 1996, only October 2022 was higher, by 0.04% on our arithmetic.
Brent averaged $114.16 a barrel in September on FRED’s daily series, against $67.99 a year earlier. On our calculation from the ECB’s reference rates, the euro’s September average against the dollar was 1.9% below September 2025’s. In euros, on our calculation (each day’s price divided by that day’s ECB rate, averaged over the month), Brent cost €99.19 a barrel in September, against €57.95 in September 2025: 71.2% more. The ECB, on August’s energy figures, said: “This increase is likely to reflect, in particular, a strong contribution from refining margins on liquid fuels, as well as higher energy commodity prices.” The price data cannot separate those two.
Household gas rose 11.1% and electricity 4.4% in the year to September, both below their 2022 peaks
The World Bank’s monthly average for European gas prices, the Dutch TTF price since April 2015, was $25.42 per mmbtu in September, 128.6% above September 2025’s $11.12 and up 116.2% since January, on our arithmetic from the World Bank’s monthly Pink Sheet data. It was the highest monthly average since December 2022, though well short of the August 2022 peak of $70.04.
What households pay has moved less. Eurostat’s gas index rose 11.1% on the year, the most since February 2023, and 11.6% from January to September on our arithmetic. Electricity rose 4.4% on the year, the most since January 2025, and 3.3% since January on the same arithmetic. Of energy’s 2.10-point rise in contribution since January, gas and electricity account for 0.53 and petrol and diesel for 1.36, on our sums of Eurostat’s item figures.
In September 2026 the household gas index was 16.3% below its October 2022 peak and electricity 10.8% below its own, on our arithmetic from Eurostat’s indices. In the last episode the order was: the petrol and diesel indices peaked in June 2022, the World Bank’s European gas price in August 2022, and the household gas and electricity indices in October 2022. That is when and by how much. The data do not show why, and one episode is not a rule. The ECB’s statement of 10 September named gas as an upside risk: “Gas prices, in particular, could increase in the event of further supply disruptions or an unusually cold winter coinciding with low storage levels.”
In September 2026, Lithuania was at 6.1% and Malta at 2.4%
The euro area has had 21 members since Bulgaria joined on 1 January 2026. In September Lithuania’s rate was the highest, at 6.1%, followed by Bulgaria at 5.6%, Luxembourg and Cyprus at 5.2%, Greece at 5.1% and Spain at 5.0%. Malta’s was the lowest, at 2.4%, then Finland’s at 2.7%. Ten of the 21 were at or above the euro-area rate; none was below 2%. The rate rose from August in 17 members, held in three and fell only in Slovakia.
Among the largest economies, Germany was at 3.3% (2.9% in August), its highest since December 2023; France at 3.4% (2.6%), its highest since January 2024; Italy at 4.2% (3.2%), its highest since September 2023; and Spain at 5.0% (4.6%), its highest since February 2023.
Energy prices rose by more than 10% on the year in 20 of the 21 members, from 13.1% in Finland to 33.0% in Lithuania. The exception is Malta, where energy’s annual rate was 0.0% in every month from January to September 2026, and whose headline rate was the lowest. Greece, fifth on the headline, had the highest core rate of the 21, at 4.6%.
The ECB raised its deposit rate in June and September 2026
On 10 September the ECB’s Governing Council raised its three key rates by 25 basis points, taking the deposit facility rate to 2.50% from 16 September. The rise before it, from 2.00% to 2.25%, took effect on 17 June. The decision said: “The conflict in the Middle East continues to generate inflation pressures, and inflation is set to remain well above target for an extended period.”
ECB staff’s September baseline, which is the ECB’s projection and not ours, has headline inflation averaging 3.0% in 2026, 2.5% in 2027 and 2.1% in 2028, and inflation excluding energy and food at 2.5% in 2026. The statement added: “Higher energy prices are expected to feed through gradually to core and food price inflation.” September’s figures do not settle that either way: the rate excluding energy is where it was in January, but non-energy goods inflation has risen since. The statement gave August’s inflation as 3.3%, the flash figure; Eurostat has since put it at 3.2%.
What this cannot settle
Contributions are accounting, not causes. They show which prices rose and by how much of the total, rounded to two decimals. They do not show whether the fuel prices reflect crude, refining margins or the exchange rate.
A flat rate outside energy is not proof that energy stays contained. The ECB expects a gradual pass-through. Whether the rise in non-energy goods inflation since January is energy feeding into other prices, the index cannot say.
The fuel highs are nominal, and two of the series are short. The transport fuel, liquid fuel and energy indices start in January 1996; the diesel and petrol indices in December 2016. None is adjusted for incomes or general prices.
Wholesale and household gas are different prices. The World Bank’s figure is a monthly average of the TTF price in dollars; Eurostat’s index is what households pay, in euros. The piece shows when and how much each moved, not how one passes into the other.
The series were rebuilt in 2026. Eurostat moved the index to a new classification and back-cast it; in the old dataset no month from 1997 to 2025 differs by more than 0.1 point, and the September 2023 comparison is the same. The euro area itself changed in January, when Bulgaria joined.
What to watch
29 October. The ECB’s next monetary policy decision, at the end of its 28–29 October meeting, with the deposit rate at 2.50%.
4 November. Eurostat’s flash estimate for October; the final follows on 18 November. On our arithmetic from Eurostat’s indices, the energy index fell 0.16% on the month in October 2025; if energy prices are unchanged on the month in October 2026, energy’s annual rate would be 19.1%, and Eurostat’s one-decimal figure would show less than September’s 18.9% only if they fell by more than about 0.24%. Over 1–14 October, Brent averaged €113.25 a barrel on our calculation, 14.2% above September’s average.
Household gas and electricity in the October data. In September 2026 their indices were 16.3% and 10.8% below their October 2022 peaks on our arithmetic; in 2022 they peaked two months after the World Bank’s gas price.