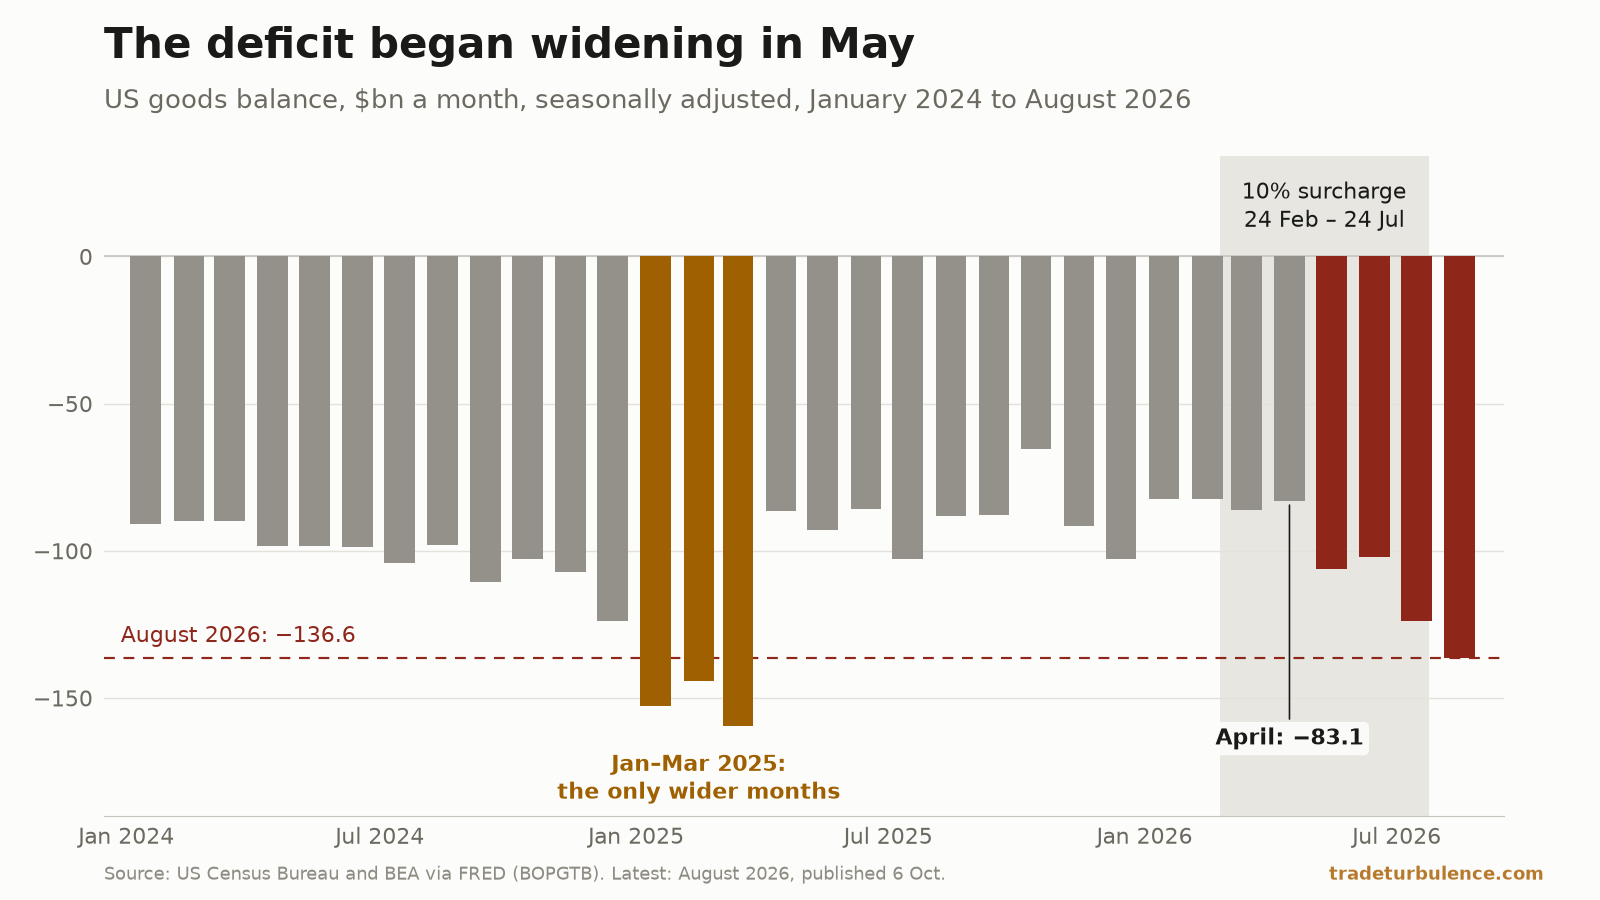
The US goods deficit reached $136.6bn in August, its widest since March 2025. Of the $53.5bn widening since April, $40.7bn was in the data by July.
Macroeconomics & policy
Labour, output and the policy response — the second-order effects that show up in the aggregate data months after the event that caused them.
7 pieces
Mar 2026 – Oct 2026
Every figure traces to a named public source.
- The index went calm the week oil went violent
The Stress Index printed Settled on 12 August with its energy score above 90. In 4,814 trading days since 2008, that pairing had never appeared before.
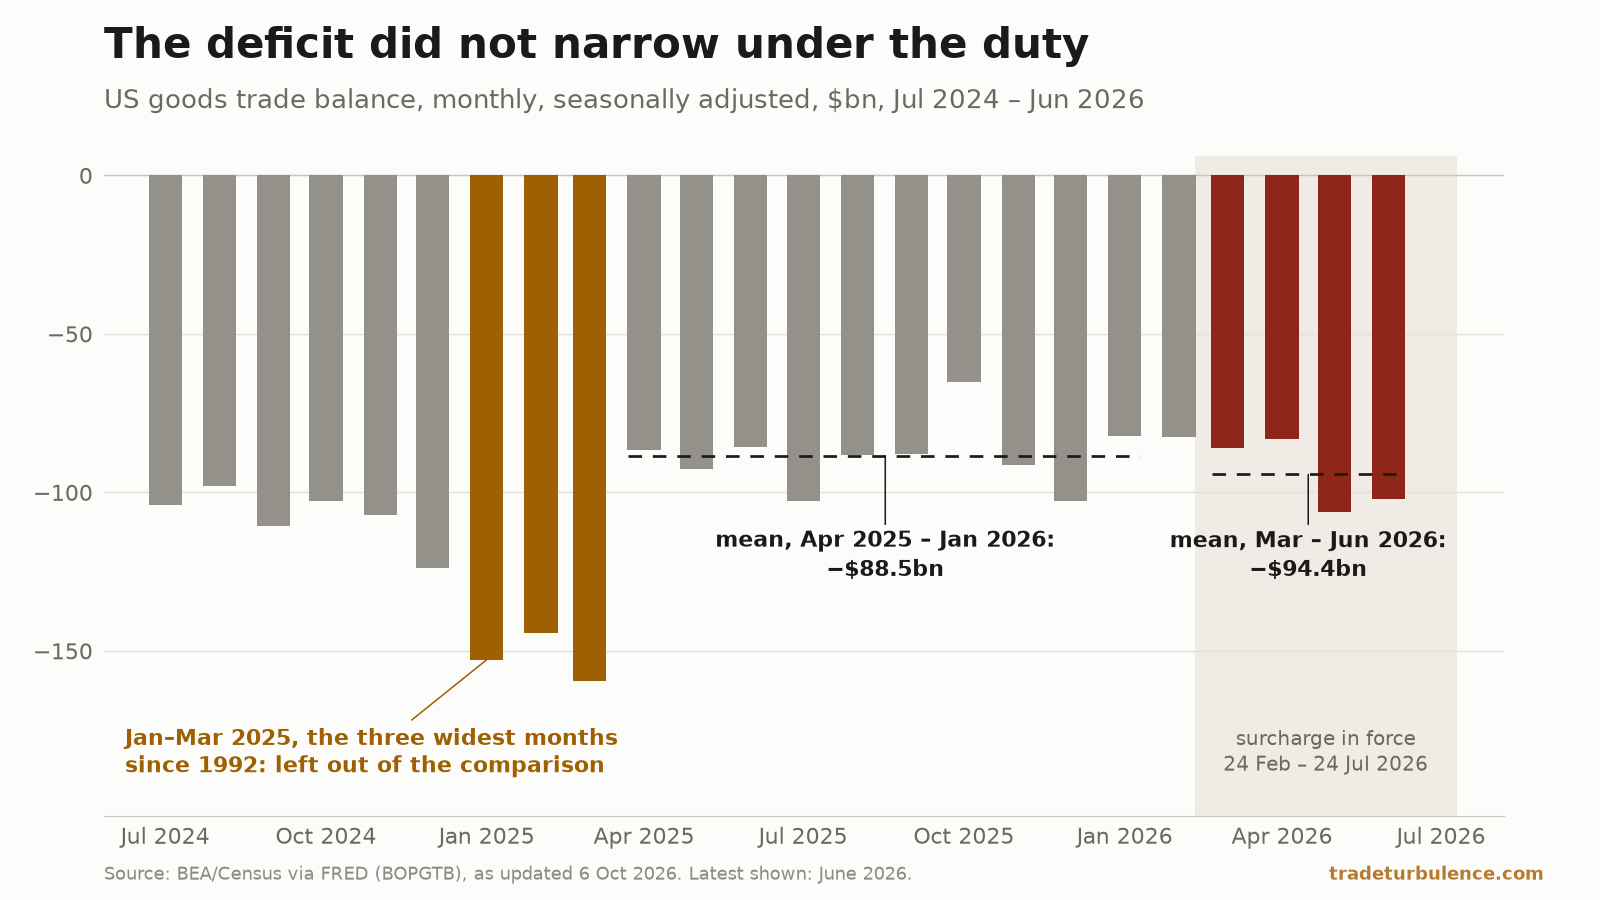
- The surcharge ran 150 days. The deficit did not narrow.
A 10% import surcharge ran from 24 February to 24 July 2026 to fix the payments deficit. The goods deficit: $88.5bn a month before it, $94.4bn during it.
- The stress index reads Normal. Nothing inside it does.
The TradeTurbulence Stress Index sits at 49.0 — energy 86.7, trade activity 10.4. Three months in 221 have carried that signature. They ended differently.
- The 30-year is not high. The last 19 years were low.
The long bond at 5.16% is being read as a 2007 high. Against its own 49-year history it sits below the median — and one thing about this week is genuinely new.
- AI Disruption in India's IT Sector: Navigating a Transformative Future
Explore the potential impact of AI on India's IT sector, with insights into market dynamics, economic implications, and strategic pivots necessary for adaptation.
- The AI Revolution: The White-Collar Extinction Event and the Slow Unmaking of Modern Cities
Explore the transformative impact of AI on global economies, with a focus on rising unemployment, real estate market shifts, and potential policy responses to …



Other sections
About this section
The decisions of central banks and finance ministries shape the environment in which every market operates. Whether the Federal Reserve adjusts its policy rate, the European Central Bank recalibrates its balance sheet, or the Bank of Japan intervenes in currency markets, these actions cascade through bond yields, equity valuations, and currency crosses. This section provides rigorous analysis of macro policy and its market implications.
Inflation dynamics have returned to center stage after years of subdued readings. We track how supply shocks, labor market tightness, and base effects interact with monetary policy to determine the path of consumer prices. GDP analysis and employment data offer real-time signals of economic momentum, while fiscal policy—government spending, tax changes, and deficit trajectories—adds another dimension to the outlook. Interest rates remain the primary transmission mechanism, and we examine how shifts in the yield curve reflect changing expectations for growth, inflation, and policy.
Our analysis integrates data from FRED and other authoritative sources to ground narrative in evidence. From Fed dot plots to ECB staff projections, from Japanese wage negotiations to Chinese stimulus measures, we connect policy developments to their market consequences. For traders, allocators, and corporate treasurers, understanding macro policy is not optional—it is the foundation upon which all other analysis rests.