The US trade deficit widened $23bn in a month. The level isn't the story.
May's $23bn one-month widening was the third largest since 1992 and is not seasonal. But the deficit is trending better, not worse — and monthly swings this size have become routine.

The US goods and services deficit widened from $54.6bn in April to $77.6bn in May — a $23.0bn move in a single month. That is the third largest one-month widening in 412 monthly changes since 1992, and it is not a seasonal artifact. It is also, on its own, close to meaningless as a signal about trade. The twelve-month deficit is $329bn narrower than it was a year ago, and the monthly series has entered a volatility regime where moves of this size have stopped being rare.
Two things are true at once here, and most coverage of a monthly trade print picks one and drops the other. The single-month move genuinely was extreme. The condition it supposedly describes — American demand pulling in a wave of foreign goods — is not what the annual data shows.
What actually moved
The deficit is the difference between two very large numbers, so it is worth separating them.
| April → May 2026 | April | May | Change |
|---|---|---|---|
| Imports, goods & services | 382,758 | 395,263 | +12,505 |
| Exports, goods & services | 328,187 | 317,677 | −10,510 |
| Balance, goods & services | −54,570 | −77,585 | −23,015 |
| Balance, goods only | −82,912 | −106,485 | −23,573 |
| Balance, services only | 28,342 | 28,899 | +557 |
All figures $m, balance-of-payments basis.
Three observations follow immediately.
Both sides contributed, roughly evenly. Imports rose $12.5bn and exports fell $10.5bn. This was not simply an import surge; American exporters shipped $10.5bn less in May than in April, and that half of the move has attracted almost no attention.
It was entirely a goods story. The goods balance deteriorated by $23.6bn while the services surplus actually improved slightly, to $28.9bn. Services — the part of US trade least exposed to tariffs, shipping and inventory timing — did not move.
China explains less than a third of the import rise. US goods imports from China went from $19.79bn to $23.51bn, up $3.72bn. Against a $12.5bn total import increase, that is about 30%. The remaining $8.8bn came from elsewhere, and the monthly bilateral data available at this vintage does not tell us where.
The seasonality check, because May is suspicious
A single month that breaks a pattern deserves a seasonality test before it earns a headline. April-to-May could simply be a month that habitually widens.
It is not. Across 35 April-to-May transitions since 1992, the average change is −$483m and the median is −$98m — effectively zero. Not one of those 35 May prints widened more than 2026’s. Whatever happened in May, the calendar did not do it.
The move is 3.8 standard deviations from the mean monthly change of −$183m. Only January 2025 (−$27.9bn) and November 2025 (−$26.5bn) were larger.
The finding that matters: the series has changed character
Notice that both larger widenings were in the last eighteen months. That is not a coincidence, and it is the real story in this data.
| Era | Std dev of monthly change | Months moving more than $15bn |
|---|---|---|
| 1992–1999 | 1,321 | 0 of 95 (0.0%) |
| 2000–2007 | 2,502 | 0 of 96 (0.0%) |
| 2008–2015 | 4,243 | 1 of 96 (1.0%) |
| 2016–2023 | 4,995 | 1 of 96 (1.0%) |
| 2024–2026 | 18,886 | 10 of 29 (34.5%) |
Std dev in $m.
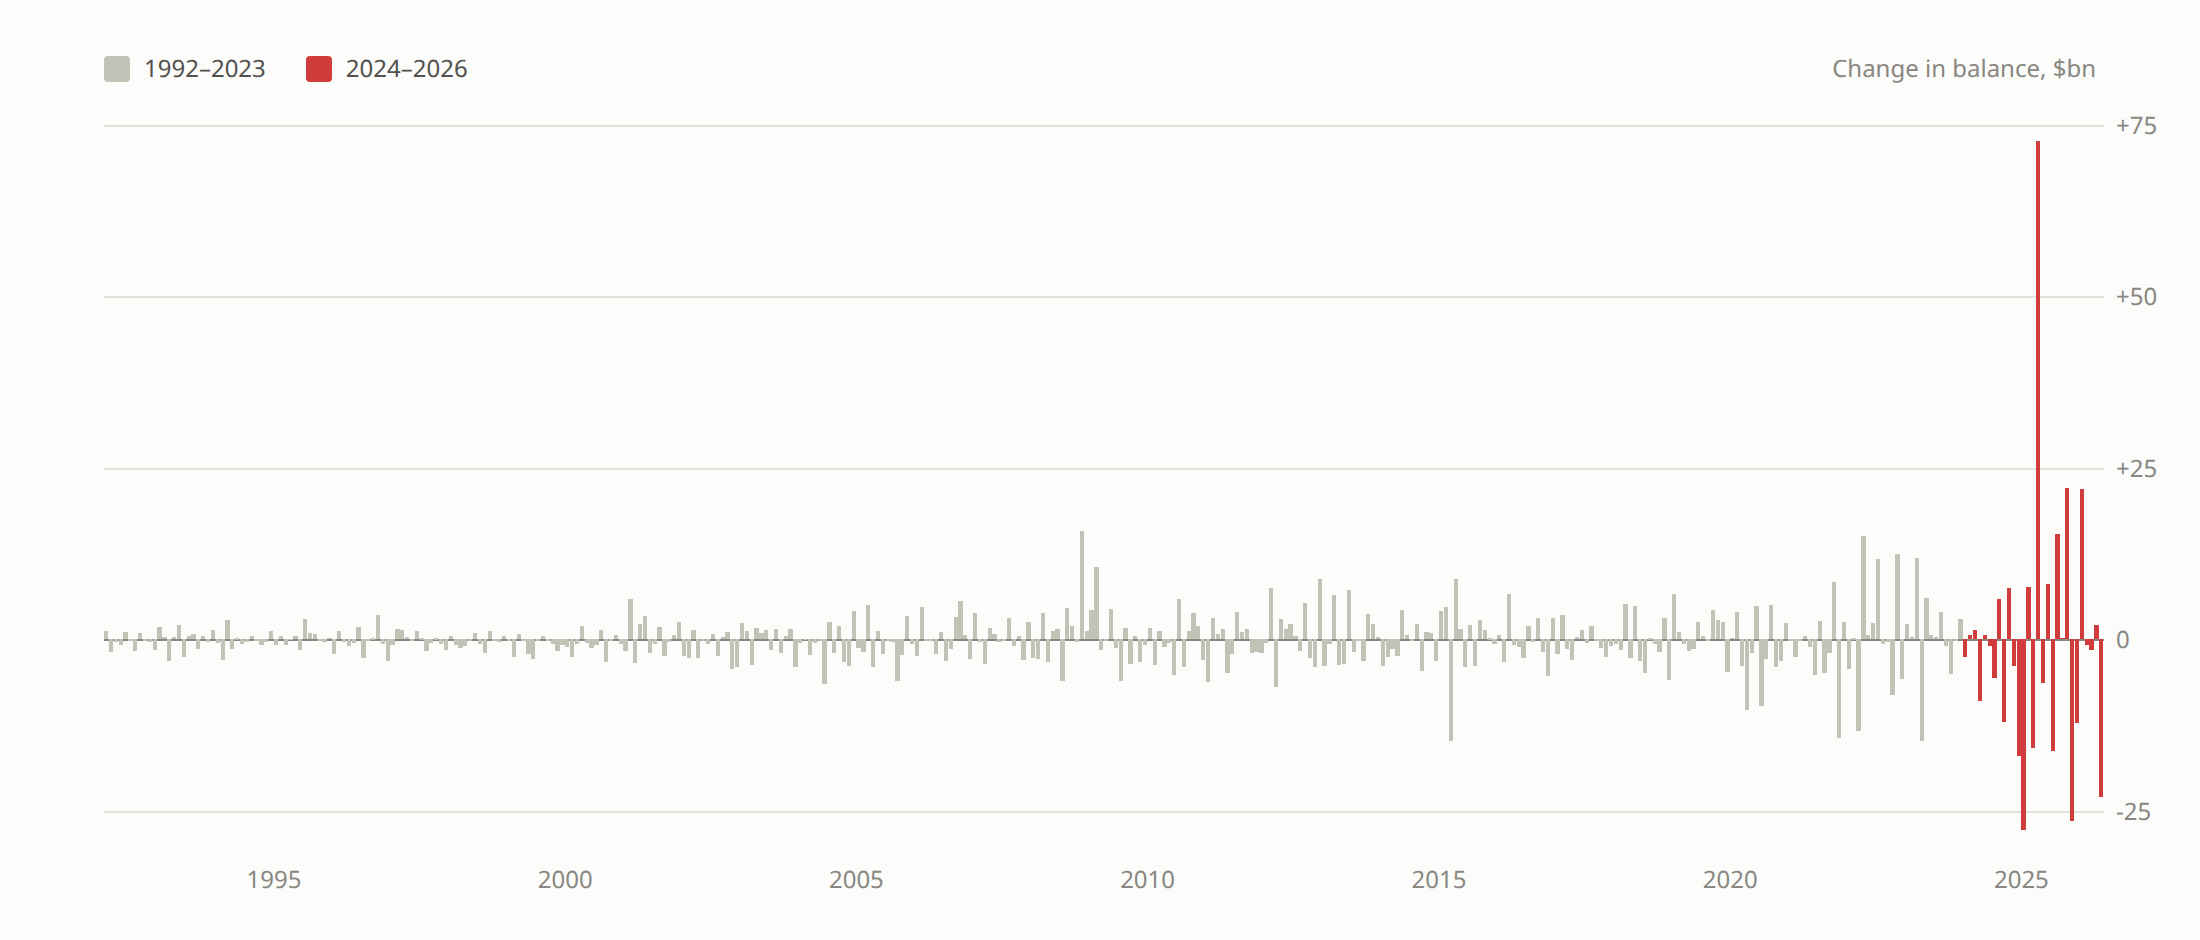
The month-to-month standard deviation has quadrupled. A move above $15bn used to happen roughly once a decade; over the past twenty-nine months it has happened in more than a third of them. April 2025 alone saw the deficit narrow by $72.6bn in one month — the largest single-month swing in the series’ history, in the opposite direction.
A series behaving like this is no longer measuring what a monthly reader assumes it measures. It is picking up the timing of shipments rather than the volume of trade: importers pulling orders forward ahead of an expected tariff date, then stopping; inventories built in one month and drawn down the next. The underlying flow can be perfectly stable while the monthly print swings by $70bn.
What the annual picture says instead
If the monthly data is dominated by timing, the twelve-month totals are where the trend lives. They point the other way.
| Twelve months to | Cumulative balance |
|---|---|
| May 2024 | −$761.6bn |
| May 2025 | −$1,057.0bn |
| May 2026 | −$728.0bn |
The trailing-year deficit has narrowed by $329bn from its 2025 level and is now smaller than it was in 2024. January-to-May 2026 (−$297.9bn) compares with −$501.8bn over the same months of 2025.
And May’s absolute level, for all the drama of the change, ranks only 14th widest of 413 months. The record is −$133.0bn, set in March 2025.
Meanwhile imports and exports are growing at almost the same pace — imports +13.3% year on year, exports +12.6%. Trade is expanding on both sides of the ledger. That is not the signature of a demand-driven import shock.
What our own index says
The TradeTurbulence Stress Index reads 49.9 — squarely normal, at the 62.9th percentile of the last five years. Its global trade activity component reads 10.4 out of 100, one of the calmest readings it produces.
That component derives from Kilian’s index of global real economic activity, built from dry-bulk shipping rates, and it happens to be observed for May 2026 — the very month in question. Its value of 54.26 is higher than 86% of all months since 1968 and 88% of the last five years. On the freight-derived measure, global trade activity in May was strong, not stressed.
So for the same month in which the US monthly balance moved 3.8 standard deviations, the physical measure of world trade activity was near the top of its historical range. Those two facts are compatible only if the monthly balance is being driven by something other than the volume of goods actually moving.
What this does not settle
We cannot attribute the May move to a specific cause from this data. Tariff front-running is the most plausible explanation given the volatility pattern and the concentration in goods, but a $12.5bn import increase can also come from a small number of very large one-off items — aircraft, pharmaceuticals, precious metals — and the vintage available here does not break imports down finely enough to test that.
Two further caveats. May 2026 is the most recent month published; trade data is routinely revised, and a first print of this size is a candidate for revision. And the deficit is a nominal dollar figure, so part of any move reflects price rather than volume.
What to watch
- The June print. If the deficit snaps back toward the $55bn where January to April sat, May was timing. If it holds near $77bn, something structural changed. The Dec 2025 → Jan 2026 sequence did exactly this: −$76.1bn, then −$54.2bn the following month.
- Whether exports recover. The $10.5bn export decline is the half of this move with no obvious tariff explanation. A rebound points to noise; a second monthly fall is the more serious signal.
- The services surplus, at $28.9bn. It has sat between $26.5bn and $29.5bn for eight months. Services are the part of the account least exposed to shipment timing, so movement there would indicate something real rather than logistical.
IGREAfor June and July, published with a one-to-two-month lag. If freight-derived activity stays in the top decile while the US monthly balance keeps whipsawing, the case that these prints measure timing rather than trade gets stronger.
All figures in this piece come from the linked series and can be reproduced by downloading them directly; the trade balance data is published on a balance-of-payments basis by the Census Bureau and BEA. Our own index history is available as open data.