The Strait of Hormuz hit zero three times. It is still at 18%.
Transits through the Strait of Hormuz fell from 152 on 22 February to zero on 13 March. July ran at 16.5 a day against an 89.7 baseline — 18% of normal.

On 22 February the Strait of Hormuz carried 152 vessels, its busiest day of the year. On 13 and 14 March it carried none, and on 27 April none again — the only three days in seven and a half years of satellite records with no transit at all. Traffic through July ran at 16.5 a day against an 89.7 pre-war baseline: 18% of normal, five months after the stoppage. The Stress Index reads 47.2 — Normal.
The record shows a cliff, not a slope
Daily transit calls at the Strait of Hormuz, derived from IMF PortWatch satellite AIS counts:
| Date | Vessels | Deadweight moved |
|---|---|---|
| 22 February | 152 | 5.70m t |
| 28 February | 57 | 3.02m t |
| 1 March | 24 | 0.85m t |
| 2 March | 6 | 0.07m t |
| 4 March | 2 | 0.04m t |
| 12 March | 1 | 0 |
| 13 March | 0 | 0 |
| 14 March | 0 | 0 |
Nineteen days separate the busiest day of 2026 from the first day on which nothing moved. February as a whole averaged 89.4 transits a day, within half a percent of the 2019–2023 baseline of 89.7 — this route was working normally until the week it stopped.
The zeros are not single-session artefacts. They sit inside a run of days reading 1 and 2, and the strait moved zero deadweight tonnage on four separate days — 12, 13 and 14 March, and again on 27 April. Those are the only four such days since the series begins in January 2019, a window that includes the whole of the pandemic.
March averaged 4.8 transits a day, down 94.6%. The lowest 30-day mean anywhere in the record ends on 31 March 2026 at 4.2. The lowest before this year was 51.8, in December 2019 — twelve times higher.
None of this turns on the choice of baseline. July’s 16.5 is 18.4% of the 2019–2023 mean, 18.0% of calendar 2025, 18.2% of the twelve months to the outbreak, and 16.0% of 2022’s peak year. Every available definition of normal puts the fall between 82% and 84%.
The insurance market repriced the whole Gulf three days into the collapse
The transit data does not stand alone. On 3 March, with the count already down to 5 a day, the Lloyd’s Market Association and IUA Joint War Committee issued circular JWLA-033, amending the Hull War, Piracy, Terrorism and Related Perils Listed Areas.
What it added is the informative part. Iran, Iraq, Saudi Arabia’s Gulf coast, the UAE and Yemen were already listed before the war. The five names added on 3 March were Bahrain, Djibouti, Kuwait, Oman and Qatar — four of them the neutral states on the far side of the strait, and the fifth guarding the Red Sea approach. The committee also redrew the boundaries of the “Persian/Arabian Gulf, Gulf of Oman, Indian Ocean, Gulf of Aden and Southern Red Sea” area, extending it east to 65°E off the Pakistan coast and south to the Somalia border.
Satellite positions and a London underwriting committee share no inputs and reached the same conclusion within seventy-two hours. The AIS count measures ships that moved; the circular prices the risk of moving them. When both turn at once, the reading is not an artefact of either.
The tonnage fell further than the ship count
Vessel counts and cargo capacity are separate series, and they moved apart.
| Window | Transits/day | vs baseline | Deadweight/day | vs baseline |
|---|---|---|---|---|
| February 2026 | 89.4 | −0.4% | 3.35m t | −6.2% |
| March 2026 | 4.8 | −94.6% | 0.11m t | −97.0% |
| July 1–23 2026 | 16.5 | −81.6% | 0.57m t | −84.1% |
Capacity falls further than the count in every window. Ships still moving are systematically smaller than the ships that stopped — the largest hulls are the ones owners will not risk. Lloyd’s List Intelligence, working from commercial tracking rather than this dataset, reports the same asymmetry in its 21 July brief: VLCC movements fell to nine transits in the week of 13–19 July, from 35 the week before.
The EIA put 2024 flows through the strait at 20 million barrels a day — about 20% of global petroleum liquids consumption and more than a quarter of seaborne oil trade. A deadweight series down 84% is describing that traffic.
This is not the Red Sea, and the difference is the entire story
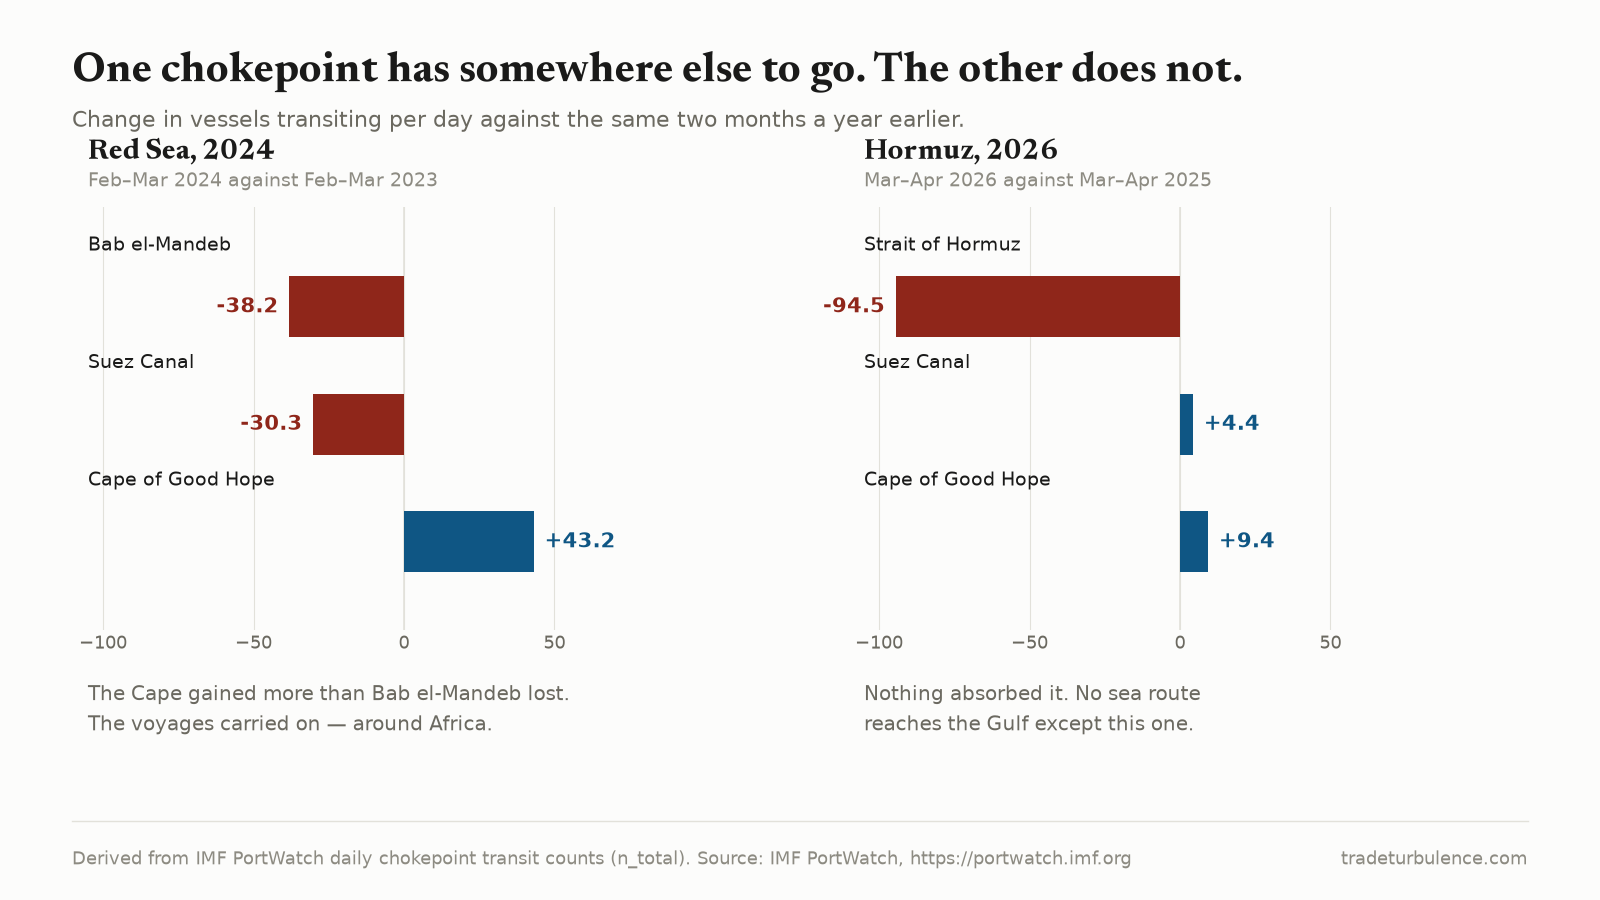
The 2023–24 Red Sea crisis is the reference case for a chokepoint disruption, and it is the wrong analogy. Measured the same way — the two months after the shock against the same two months a year earlier — Bab el-Mandeb lost 38.2 transits a day and the Suez Canal 30.3, while the Cape of Good Hope gained 43.2 — more than Bab el-Mandeb gave up. Total traffic across all 28 chokepoints fell 2.9%. Ships did not stop sailing; they sailed around Africa, and the cost came in weeks and bunker fuel rather than in cargo that never moved.
Hormuz has no Cape of Good Hope. On the same construction, the strait lost 94.5 transits a day, or 93.5%. The largest gainer anywhere on the network was the Cape of Good Hope at +9.4, a tenth of the loss; Suez managed +4.4. Total chokepoint traffic fell 6.4%, more than twice the Red Sea figure.
Nothing absorbed it because there is nothing to absorb it. The Persian Gulf has one sea entrance. The EIA counts two pipeline bypasses — Saudi Arabia’s East–West line to Yanbu and the UAE’s line to Fujairah — and put their combined spare capacity at about 2.6 million b/d against roughly 20 million b/d of normal flow: an escape route for something under one barrel in seven. For LNG there is no bypass at all: Qatar shipped about 9.3 billion cubic feet a day through the strait in 2024, and Hormuz carried a fifth of world LNG trade. A liquefaction train has no pipeline to Yanbu.
The strait’s share of global chokepoint traffic has gone from 4.51% in the baseline period to 0.88% in July. The site’s Route Displacement Index — the share of chokepoint traffic sitting on a different route than in 2019–2023 — reads 9.69 against a baseline mean of 3.85, and set its record high of 9.83 on 27 April, the day of the third zero.
June was a pause in the war, not a reopening
The recovery that followed the late-June memorandum looks larger in the commentary than in the count. The best single day since the war began was 51 transits on 24 June — 57% of baseline, and still the post-war high. No day since 28 February has reached the baseline at all. Of the 146 days from 28 February to 23 July, 104 came in at ten transits or fewer.
Then it broke again. Tankers including the Qatari LNG carrier Al Rekayyat and the Saudi supertanker Wedyan were hit on 7 July (Al Jazeera). The transit series turns on the following day, without being told to:
- 1–7 July: 29.9 transits a day, 1.39m t of deadweight
- 8–23 July: 10.6 transits a day, 0.21m t — down 64% by count and 85% by tonnage
Al Jazeera’s report described traffic at “between one-third and one-fifth of pre-war levels”. The measured July figure — 18.4% of the 89.7 baseline — sits just below the bottom of that range, from an independent method.
What the pause cost in forecasting terms is on the record. On 7 July the EIA raised its global production forecast and cut its third-quarter Brent projection by $27 a barrel to $74, citing shipping traffic that “has increased following the June 18 memorandum of understanding” (EIA). The reopening it rested on was real but partial: June averaged 15.1 transits a day, 17% of baseline. The revision was published the day the tankers were hit and the day before the transit count halved.
Nothing about that was unreasonable at the time. Brent spot closed at $71.78 on 7 July, so a $74 third quarter was close to the screen. What followed is the point:
| Date | Brent spot, $/bbl |
|---|---|
| 3 July | 68.68 |
| 8 July — transits halve | 76.50 |
| 17 July | 85.01 |
| 23 July | 105.32 |
| 27 July | 91.82 |
Brent rose 53.3% from 3 to 23 July, and did not clear $100 until fifteen days after the transit count broke (EIA). The physical series moved first and the price spent three weeks catching up. Anyone reading only the price in the second week of July was reading a market that had not finished repricing.
Ships are not barrels, and the two public counts disagree
Everything above counts hulls. The question underneath is barrels, and the EIA counts those. On 7 April it put production shut in across Iraq, Saudi Arabia, Kuwait, the UAE, Qatar and Bahrain at 7.5 million b/d in March, rising to a projected 9.1 million b/d in April (EIA), against the 20 million b/d that normally moves through the strait. Shut-in production and transit volume are not the same quantity, so that comparison is indicative rather than exact — but it points to a disruption of roughly two-fifths.
The AIS record for those same months is more severe than that by a wide margin. Deadweight moving through the strait ran at 3.0% of baseline in March and 6.3% in April. One source describes a serious disruption; the other describes a stoppage. The gap is too large to leave unstated.
Four things sit inside it. Vessels running dark do not appear in an AIS count at all. Barrels leaving by pipeline to Yanbu or Fujairah never pass Hormuz and so never enter the transit series. Production shut in is not the same quantity as cargo exported — storage sits between them. And the April figure was a projection published on 7 April, not an observation.
Which number is closer to the truth is not resolvable from either dataset. The direction is what a reader can use: the observed, transponding, insurable traffic on which conventional trade depends fell further than the barrel accounting implies, and no reading of either series describes a working strait.
The index reads Normal, and that is not a contradiction
The Stress Index closed at 47.2 on 28 July, its 56th percentile over five years, against a long-run mean of 50.1 across 4,800 observations. Its energy component reads 92.9 — Severe, on Brent observed at one day’s lag. What holds the headline down is financial conditions at 21.3 and global trade activity at 10.4.
That composite cannot see a stopped strait, and the reason is structural rather than a fault to be patched. Four of its five inputs are prices, which register a disruption only once someone pays for it — and the July sequence above shows what that delay looks like in practice: three weeks between the transit count breaking and Brent clearing $100. Its one physical input, Kilian’s index of global real economic activity, currently observes 1 May — 88 days behind. March’s stoppage did not reach that series until late June.
An earlier piece made this point on 29 July with the strikes of that day as the example, and left it there. The chokepoint series closes it: a stoppage the composite could not register for three months was visible in transit counts within days, because PortWatch publishes weekly at a measured three-to-nine-day lag. The composite is the wrong instrument during a shock. Read the component and the physical series; read the composite afterwards, when the repricing has finished.
What this data cannot settle
An AIS count cannot see a ship that switches off its transponder. Lloyd’s List Intelligence reports that nearly 70% of observed tanker transits in the week of 13–19 July were conducted dark, up from 42% two weeks earlier. Every figure above is therefore a floor on physical movement, and a floor that is loosening as the dark share rises. What the series measures cleanly is transponding, insurable traffic — which is the traffic on which conventional trade depends.
Transits are not barrels, and the gap against the EIA’s shut-in estimate is set out above rather than smoothed over. A vessel count and a deadweight sum describe hulls and nominal capacity, not cargo loaded.
A transit count cannot see congestion. Ships waiting at anchor are invisible here; the series counts what moved, not what is stuck.
The routes that gained cannot be attributed. Mindoro, Luzon and Makassar all carry more traffic than a year ago. Whether that reflects cargo re-sourced away from the Gulf, or has nothing to do with it, is not answerable from transit counts alone.
What to watch
Whether any single day clears 51 transits. That is the post-war high, set on 24 June under a truce that has since collapsed. A day above it would be the first evidence in this series that the June arrangement is being rebuilt rather than repeated.
The deadweight series rather than the count. Capacity has fallen further than transits at every stage. A recovery in ship numbers without a recovery in tonnage means small hulls only, and the VLCC count — nine in the week of 13–19 July — is where the oil actually is.
The next Joint War Committee circular. JWLA-033 named the whole Gulf on 3 March. A subsequent circular removing Bahrain, Kuwait, Oman or Qatar would be the insurance market’s judgement that the risk has receded, and it would be published before any monthly trade statistic could show it.