The Bosporus is 34% of the rise in route displacement. Hormuz, 3%
On counts fetched 12 October, the Route Displacement Index rose from 10.42% on 8 August to 11.87% on 4 October. The Bosporus and Dover supplied 57%; Hormuz, 3%.
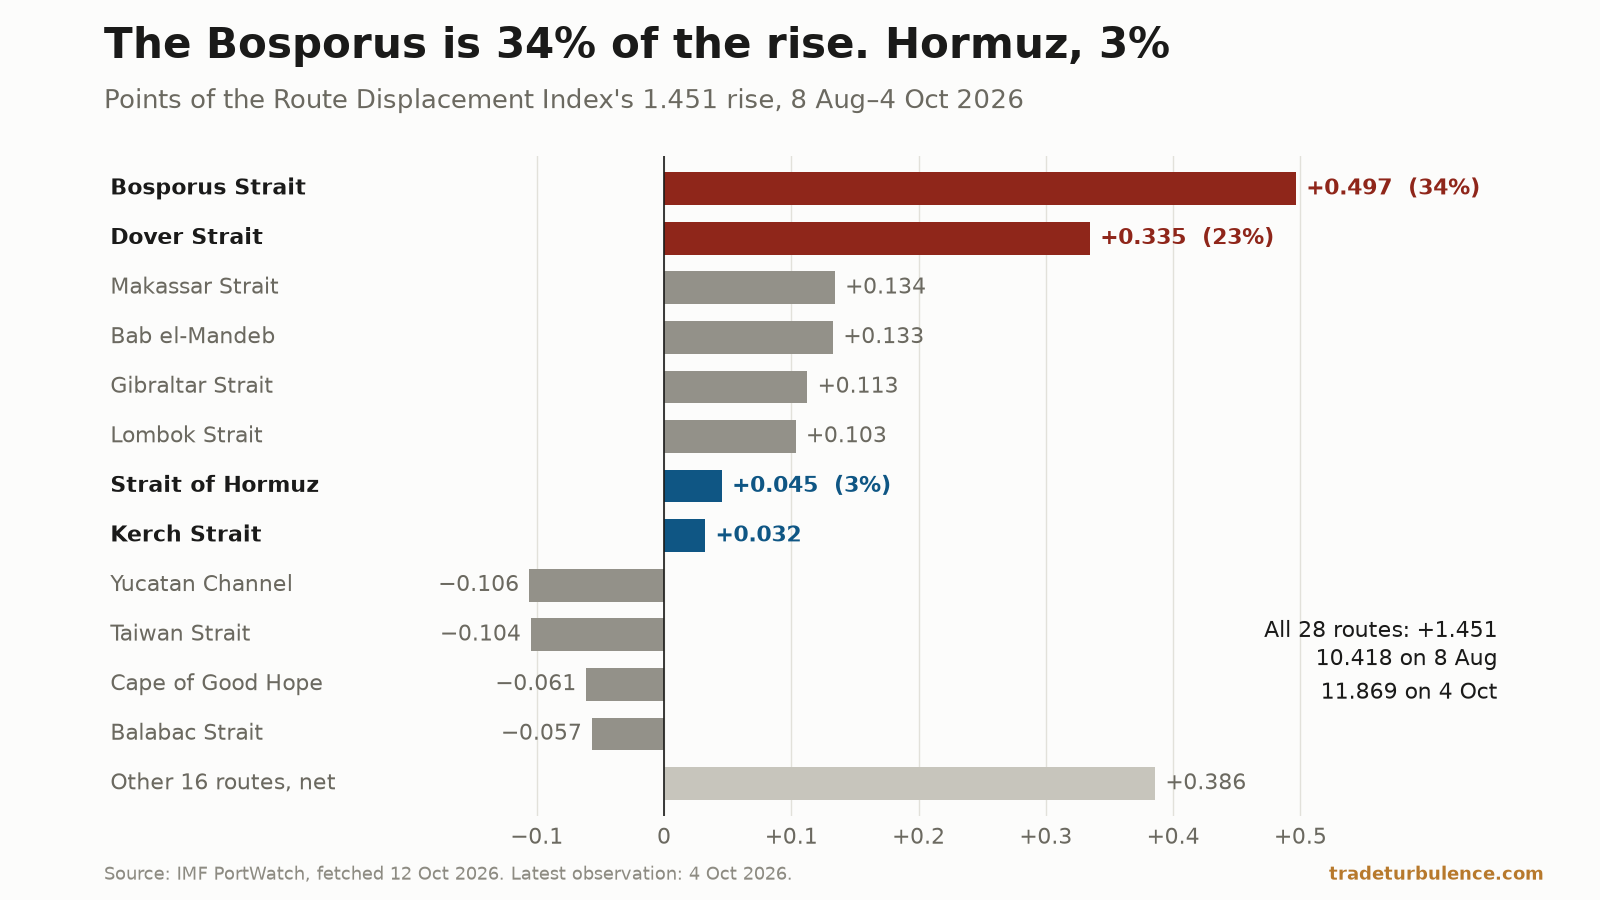
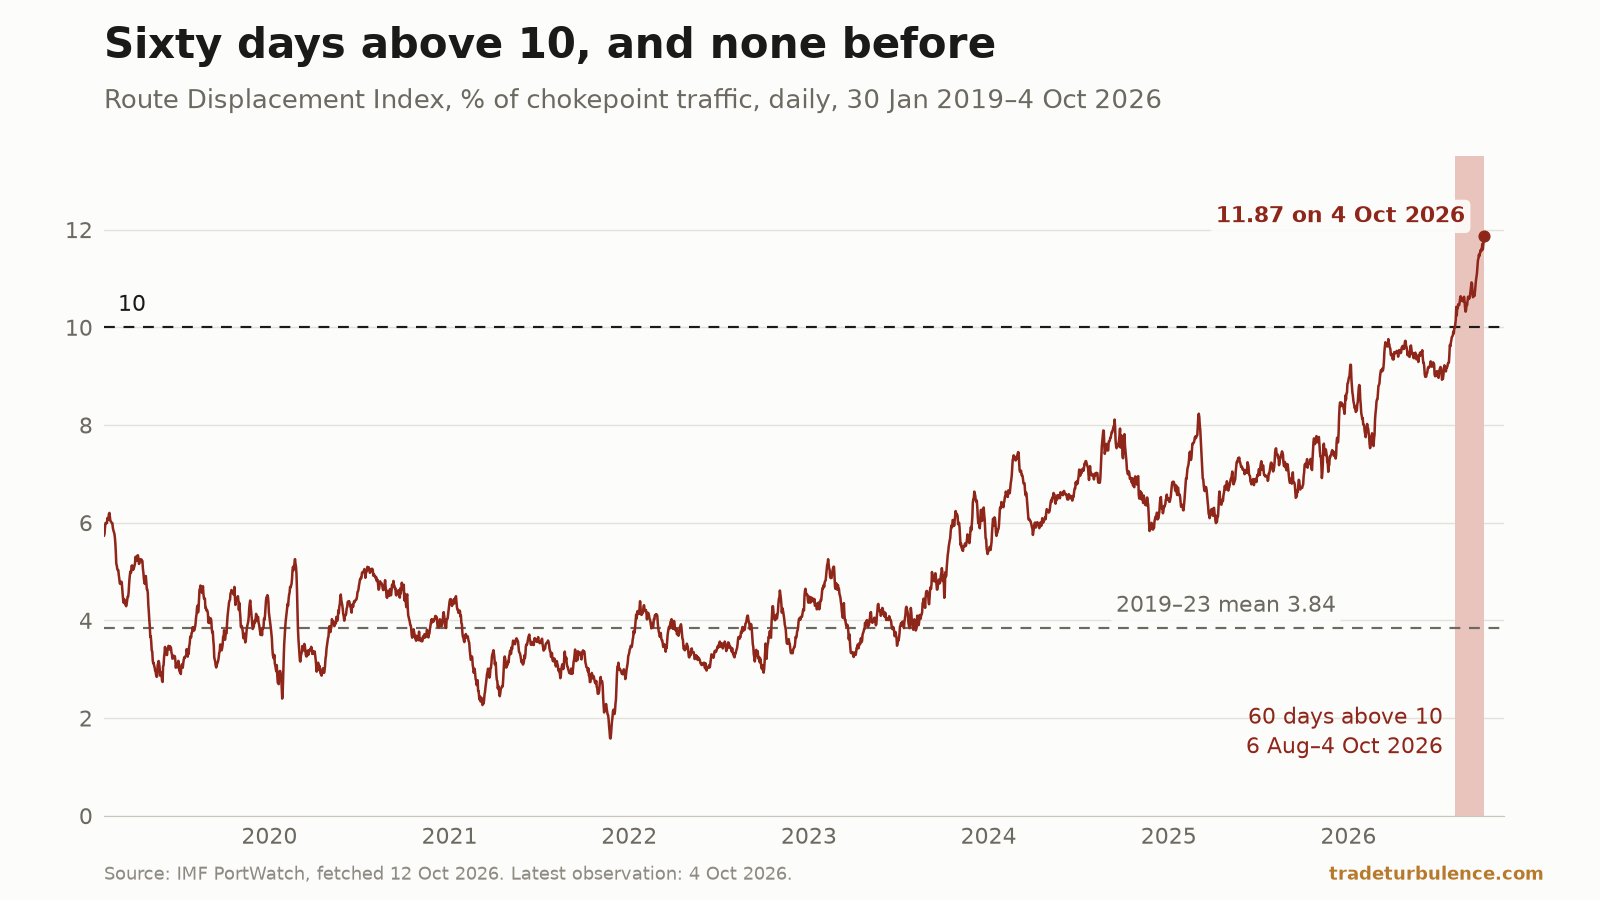
On PortWatch’s counts as fetched on 12 October, the Route Displacement Index read 11.87% on 4 October 2026, the highest of 2,805 daily readings from 30 January 2019 and the 60th in a row above 10%. That is 1.45 points above 8 August, the record day the August piece reported. The Bosporus accounts for 34% of the rise and the Dover Strait for 23%. The Strait of Hormuz, still the largest single part of the index, accounts for 3%. PortWatch has changed its history since August: the 8 August reading, printed then as 10.29, is 10.42 in the counts fetched on 12 October.
Sixty readings above 10, and none before 6 August
The index measures how far the spread of traffic across 28 maritime chokepoints sits from its 2019–2023 spread. It reads as a percentage: the share of chokepoint traffic on a different route than it used to be. It is computed from the daily transit counts of IMF PortWatch, which arrive in a weekly batch. The 2,805 readings from 30 January 2019 used here were rebuilt from those counts with the site’s formula. The CSV the site publishes holds the latest two years of them, 731 daily readings from 4 October 2024 to 4 October 2026. The reading for 4 October was eight days old when this piece was written on 12 October, and the next batch is due on 13 October.
Its baseline mean is 3.84%, and the 4 October reading is 3.09 times that. The ten highest readings in the series are the ten most recent, from 25 September to 4 October.
The August piece named three things to watch. The first was whether the index would hold above 10. It has, on each of the 60 days from 6 August to 4 October, and none of the 2,745 earlier readings in the series is above 10. The second was the 9.69 line, which that piece gave as the peak of 17 March. The index was last at or under it on 28 July, and its lowest reading after 9 August is 10.32, on 27 August. The third was Hormuz’s share, which comes below.
Earlier spells give the 60 days a scale. The index has been above 8 for 223 days, since 24 February; before that run began, the longest spell above 8 had lasted 51 days. It has been above 9 for 84 days, since 13 July, and an earlier spell above 9, from 7 March to 5 June, lasted 91. Above 10 there is no earlier spell.
The record and the 60 days were in the site’s summary of the week to 11 October. What follows is what they are made of.
The Bosporus and Dover account for 57% of the rise since 8 August
The index is half the sum, across the 28 routes, of the gap between each route’s share of traffic and its baseline share. A change in it therefore splits into 28 parts, one per route, with nothing left over. The August piece split the rise from 30 July to 8 August the same way. Between the 30 days to 8 August and the 30 days to 4 October the index went from 10.418 to 11.869. The 28 parts add to +1.4506; the two published readings, each rounded to three decimals, differ by 1.451.
| Route | Points of the rise | Share of traffic, 8 Aug → 4 Oct | Baseline share |
|---|---|---|---|
| Bosporus Strait | +0.497 | 3.67% → 2.67% | 4.93% |
| Dover Strait | +0.335 | 8.50% → 9.17% | 8.24% |
| Makassar Strait | +0.134 | 2.74% → 3.01% | 2.66% |
| Bab el-Mandeb | +0.133 | 1.72% → 1.45% | 3.07% |
| Gibraltar Strait | +0.113 | 6.99% → 7.21% | 6.51% |
| Lombok Strait | +0.103 | 1.87% → 2.07% | 1.77% |
| Strait of Hormuz | +0.045 | 0.29% → 0.20% | 4.12% |
| Kerch Strait | +0.032 | 0.06% → 0.00% | 1.89% |
| Yucatan Channel | −0.106 | 2.93% → 2.71% | 2.21% |
| Taiwan Strait | −0.104 | 12.16% → 12.50% | 12.43% |
| Cape of Good Hope | −0.061 | 4.87% → 4.75% | 2.41% |
| Balabac Strait | −0.057 | 0.68% → 0.54% | 0.55% |
| The other 16 routes | +0.386 | ||
| All 28 | +1.451 |
The rows are rounded to three decimals and add to 1.450. A route subtracts when its share moves back toward its baseline, whichever way that is: the Taiwan Strait’s share rose and the Yucatan Channel’s fell, and each took about a tenth of a point off.
Twenty routes added to the index, 1.831 points between them, and eight took 0.381 away. The Bosporus is the largest part by a distance: 34% of the net rise, and 10.9 times the part of Hormuz, which ranks 12th of the 28. Hormuz and Kerch together are 24.5% of the index and 5.4% of its rise.
The halving in the formula matters to how these numbers read. It is there so that a ship leaving one route and appearing on another is counted once. Count the losing side alone — the index is also the sum of the shares missing from routes below their baseline share — and the Bosporus gave up 0.99 of the 1.45 points, 68.5%. Count the gaining side alone and Dover took 0.67 of the 1.45, 46.1%.
The Bosporus’s 30-day traffic fell 27% while Dover’s rose 7%
A share can move because a route’s own traffic moved or because everyone else’s did. The August piece found two routes up in share while their own traffic was below baseline. That is not what happened between these two windows. The 28 routes together carried 1,843.5 vessels a day in the 30 days to 4 October, 0.4% fewer than in the 30 days to 8 August. With the total nearly flat, the share moves are the routes’ own.
The Bosporus averaged 67.9 vessels a day in the 30 days to 8 August and 49.3 in the 30 days to 4 October, a fall of 27.4%. Against its 2019–2023 baseline of 98.2 it went from 30.9% below to 49.8% below. On 3 October the average was 48.97, the lowest of the series and the only day in it under half the baseline. The Bosporus lost 18.6 vessels a day while the other 27 routes between them gained 10.7.
The season is not enough to account for that. In the seven earlier years of the series the Bosporus’s traffic fell between these two windows three times, never by more than 6.5%. By month, its daily mean was 81.7 in June, 72.1 in July, 62.1 in August and 50.8 in September.
Dover moved the other way, from 157.4 vessels a day to 169.0, up 7.4%. The record cuts against reading much into that. Dover’s traffic has risen between these two windows in all seven earlier years, by 1.2% to 3.5%, so part of the gain is the calendar. And at 169.0 it is 2.9% above its baseline but below where it stood on 4 October in each of the four years from 2022 to 2025. Its share sits above its baseline share mostly because the total sits below: the 28 routes together are 7.5% under baseline, which lifts every route’s share by 8.1%.
Nothing in these counts says the Bosporus’s ships went to Dover, or anywhere. Gains and losses of share are equal by arithmetic; whether ships moved from one route to another is a different question.
Nor do the earlier years show a regular rise in the index between these two windows. It rose in three of the seven and fell in four, by between −0.60 and +0.73; the 1.45 of 2026 is the largest of the eight. It is not the fastest 57 days in the series. Of 2,748 changes over 57 days, 129 are larger, the largest being +2.60 in the 57 days to 20 January 2022, measured up from the series low.
Hormuz is the largest part of the index, and at zero it would add 0.16
The third August marker was Hormuz’s share of traffic, “against 3.80%”. PortWatch counted 108 vessels in the strait in the 30 days to 4 October, 3.6 a day against a baseline of 82.1. That is 0.20% of chokepoint traffic, against a baseline share of 4.12%. Both figures the August piece printed, 0.21% and 3.80%, have since changed: on the counts fetched on 12 October the share in the 30 days to 9 August was 0.28%. Like for like, it has fallen, not recovered.
Hormuz remains the largest single part of the index: 1.96 of the 11.87 points, or 16.5%. Kerch, where PortWatch counted no vessel in the 30 days to 4 October, is another 0.94. But a route near zero has little left to add. With Hormuz counted at zero and the other 27 routes exactly as they were in the 30 days to 4 October, the index would read 12.02, which is 0.16 higher. Kerch is at zero already. Even from the 8 August window, the two routes at zero would have added 0.24 between them. A rise of 1.45 points had to come from other routes.
The arithmetic runs further the other way. With Hormuz at its baseline of 82.1 a day and the other 27 routes as counted, the index would read 9.51: under 10, and above every reading before 16 March 2026. These are sums on one 30-day window each, with every other route held as counted, not forecasts.
The Stress Index, on its third version, read 82.5 on 8 October: in its Severe band, and higher than every day of its 2010–2019 reference period. Its shipping-routes pillar, one of whose two inputs is this index, read 95.9. The reading quoted in the August piece came from the previous version and is on a different scale.
The 10.29 printed in August is 10.42 on the counts fetched on 12 October
The August piece warned that its record was “vintage-dependent”. Two of the site’s stored data files bound the change. In the file committed on 18 August at 19:41 UTC the reading for 8 August is 10.288; in the file committed on 26 August at 08:06 UTC it is 10.424. Each was built from a sweep that returned all 28 routes, and the code that computes the index did not change between the two. The counts PortWatch serves did, back to 2019. Against the site’s file of 11 August (UTC), whose readings the August piece printed, the 2019–2023 baseline is higher for 27 of the 28 routes, and Hormuz’s rose most, from 74.9 vessels a day to 82.1.
| Printed on 13 August | Counts fetched on 12 October | |
|---|---|---|
| Reading for 8 August | 10.29 | 10.42 |
| Readings above 10 by 9 August | 3, from 7 August | 4, from 6 August |
| Above 9 since | 19 July | 13 July |
| Highest reading before July | 9.69, on 17 March | 9.76, on 23 March |
| Baseline mean of the index | 3.82 | 3.84 |
| Hormuz, baseline share of traffic | 3.80% | 4.12% |
| Hormuz, share in the 30 days to 9 August | 0.21% | 0.28% |
| All 28 routes, 30 days to 9 August, vessels a day | 1,852.1 | 1,860.3 |
| All 28 routes, baseline, vessels a day | 1,972.9 | 1,993.2 |
The change alters how the run and the rise are counted. The run above 10 counts 60 days because 6 August, 9.92 in the file of 11 August, is 10.06 in the counts fetched on 12 October; counted from 7 August, the first day the August piece had above 10, it is 59. And of the 1.58 points between the 10.29 printed in August and the 11.87 of 4 October, 0.13 is revision of the August day and 1.45 is movement since. Across the 731 days that the file of 11 August and the counts fetched on 12 October share, the index is 0.09 higher on average in the later counts.
What this cannot settle
Why the Bosporus fell, or where its ships went. PortWatch’s counts carry no cause and no destination, and this piece offers neither.
A transit count is not tonnage, and not every ship. PortWatch counts transits by five ship types — container, dry bulk, general cargo, ro-ro and tanker — from vessels’ AIS signals, according to its dataset description. For the Bosporus there is a second count, for an earlier period. Daily Sabah, citing figures Anadolu Agency compiled from Turkey’s Directorate General of Maritime Affairs, reported 19,277 vessels through the Istanbul Strait, as Turkey calls the Bosporus, in the first half of 2026 and 19,381 in the first half of 2025. By our arithmetic on those two counts, that is 0.5% fewer. PortWatch has 15,483 for the same six months of 2026, 5.8% fewer than a year earlier and 80.3% of the directorate’s total. The two sources disagree on the size of the fall. That report stops at June, and this piece sets no second count beside PortWatch’s for August to October.
The baseline is a whole-year average and the window is 30 days. Seasonal routes move the index every year. The Bering Strait, at 4.6 vessels a day, added 0.067 points, more than Hormuz, and it has added to the index between these two windows in each of the seven earlier years.
The series may change again. The batch due on 13 October can change the reading for 4 October as well as add to it.
Hormuz has more than one count. The 11 October piece set PortWatch’s 109 Hormuz transits for September beside the “at least 477” of Lloyd’s List, which counts a different set of ships. This index uses PortWatch’s alone.
What to watch
13 October, PortWatch’s weekly batch. If every new day is above 10, the run reaches 67 days on 11 October, and the run above 9 reaches 91, level with the longest earlier spell. The batch can also change what is already published: the figure to compare is 11.869 for 4 October.
The Bosporus, against 49.1 vessels a day. That is half its baseline. Its 30-day average was 49.3 on 4 October, and the seven days to 4 October averaged 38.6, the last of them carrying 72. For the average on 11 October to sit at the half line, 5–11 October must average 52.8 a day.
Hormuz, against 5.30 vessels a day. That was its 30-day average on 8 August, the day this piece’s comparison starts from. The average has not been back at that level on any day since: the highest was 5.27, on 11 August, and it was 3.6 on 4 October.