A tenth of chokepoint traffic is on a different route.
The Route Displacement Index reached 10.29% on 8 August, the highest of 2,749 daily readings since 2019. Total chokepoint transits ran 6.1% under baseline.

The Route Displacement Index reached 10.29% on 8 August 2026, the highest of 2,749 daily readings since January 2019. The ten highest readings in the series are the ten most recent. Over the 30 days to 9 August the same 28 chokepoints carried 1,852.1 transits a day against a baseline of 1,972.9 — down 6.1%. The Stress Index reads 40.3, Normal, and fell 13.7 points over the week.
The ten highest readings in seven years are the ten most recent
The index measures how far today’s distribution of traffic across 28 maritime chokepoints sits from its 2019–2023 distribution. It reads directly as a percentage: the share of chokepoint traffic on a different route than it used to be. The baseline mean is 3.82%, and the record low 1.59% on 23 November 2021.
Three days in the series have printed 10 or above: 7, 8 and 9 August 2026. Set the bar at 9.69%, the previous peak, and only ten readings have ever cleared it — they run consecutively from 31 July to 9 August 2026. The eleventh is 17 March, during the week Hormuz stopped.
Annual means run 4.14, 3.99, 3.17, 3.66 and 4.51 from 2019 through 2023, then 6.65 in 2024, 7.00 in 2025 and 8.95 so far in 2026. Nothing here is a spike: the index has held above 8 for 167 consecutive days, since 24 February, and above 9 for 22, since 19 July. At 10.075 on 9 August it runs at 2.64 times baseline.
Two routes emptied and four absorbed the traffic
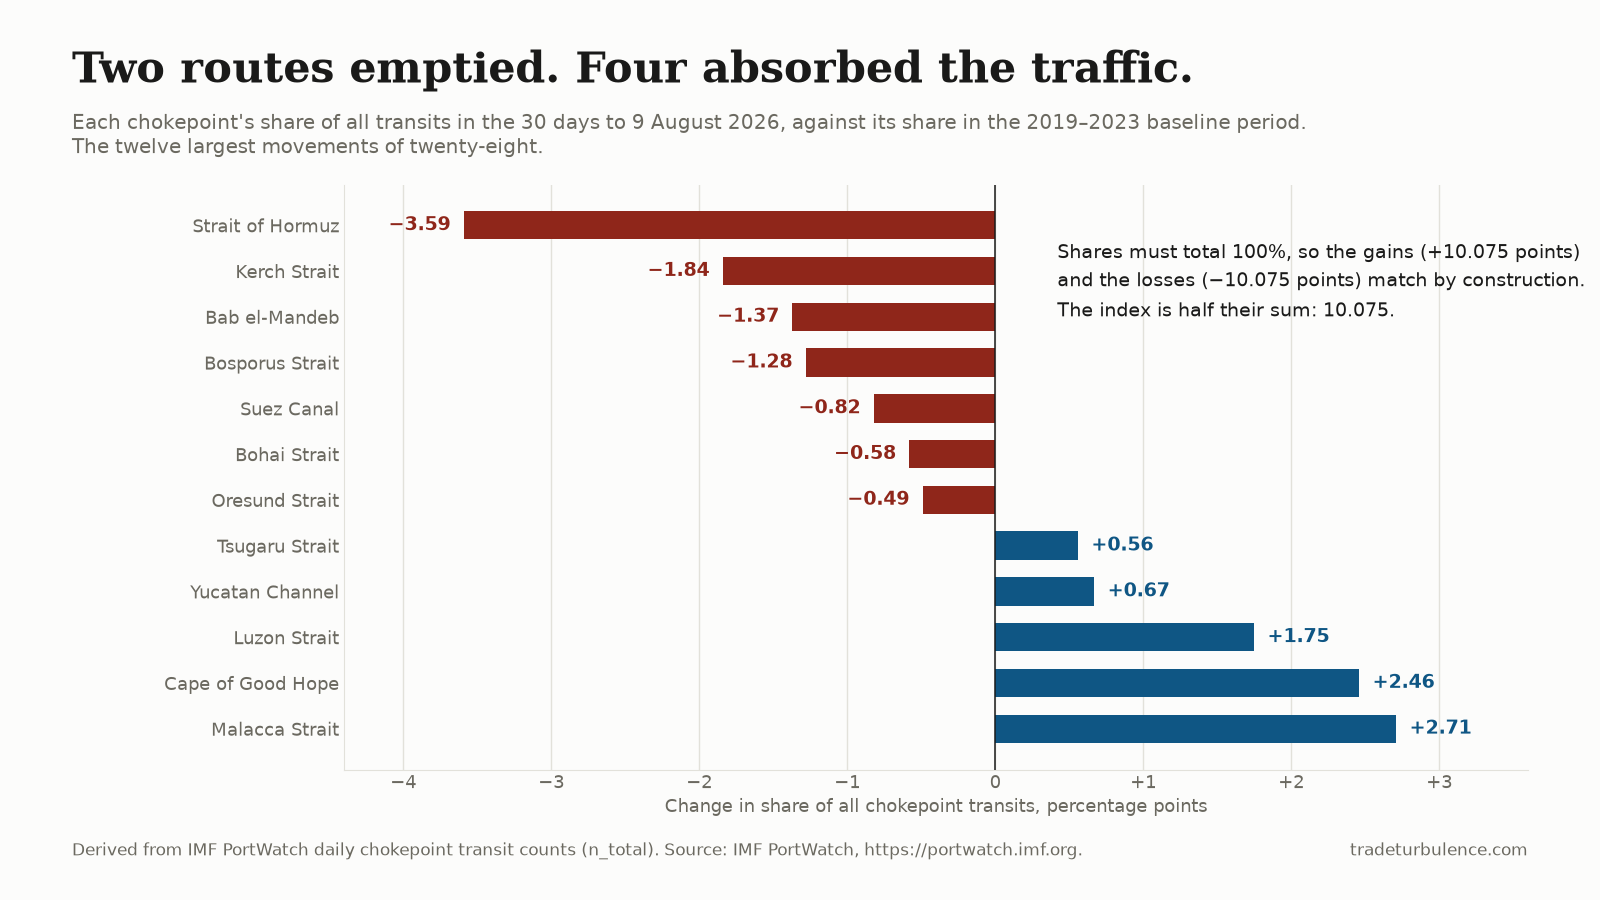
Eight routes account for 78% of the index. The two largest losses are the two routes that have effectively stopped:
| Route | Baseline share | Now | Change | Own traffic vs baseline |
|---|---|---|---|---|
| Strait of Hormuz | 3.80% | 0.21% | −3.58 pp | −94.7% |
| Malacca Strait | 9.21% | 11.92% | +2.71 pp | +21.5% |
| Cape of Good Hope | 2.40% | 4.86% | +2.45 pp | +89.6% |
| Kerch Strait | 1.90% | 0.06% | −1.84 pp | −97.0% |
| Luzon Strait | 3.52% | 5.27% | +1.75 pp | +40.5% |
| Bab el-Mandeb | 3.08% | 1.71% | −1.37 pp | −47.9% |
| Bosporus Strait | 4.92% | 3.64% | −1.28 pp | −30.6% |
| Suez Canal | 3.05% | 2.23% | −0.81 pp | −31.2% |
Hormuz alone carries 17.8% of the index. Add Kerch and it is 26.9%; add Bab el-Mandeb, the Bosporus and Suez and five routes carry 44.1% of the total.
The gains and the losses are equal, at 10.075 points each. That is arithmetic rather than evidence: shares sum to 100%, so they must be. Whether the ships that left one route joined another is a separate question, and it needs volume.
The routing change is larger than the volume change
The 28 chokepoints carried 1,852.1 transits a day in the 30 days to 9 August, against 1,972.9 across the 1,765 days of the baseline window: −6.1%. Annual means have drifted down for three years, from 2,049.2 in 2023 to 1,981.0, then 1,957.1, and 1,882.5 so far in 2026.
Both things are true and they are not the same size. Total traffic is down about a sixteenth; the share of it sitting on a different route is a tenth, and at a record. An index built on volume would show a mild three-year drift and nothing else.
A share can rise without a single extra ship
Shares are relative, so a route can gain share while carrying no more traffic than before, simply because others collapsed. Two gainers on the board are exactly that. Gibraltar is up 0.38 points of share on traffic −0.7% against its own baseline; Dover is up 0.18 points on −4.1%. Neither absorbed anything. They stood still while the denominator moved.
The four that genuinely took traffic on are Malacca, the Cape, Luzon and the Yucatan Channel, each up on its own baseline in absolute terms as well as in share. Checking a share move against the route’s own level separates the two cases, which is why the board publishes both readings.
That test also explains the past ten days. The index rose 0.61 points between 30 July and 8 August, and the largest single contributor was the Taiwan Strait, worth 0.13 of that: its share slipped from 12.43% to 12.18% against a 12.48% baseline. Hormuz added 0.12 and the Bosporus 0.10, while Bohai and Malacca moved back toward their baselines and subtracted 0.15 between them.
What this cannot settle
A transit count is not tonnage. These are vessel movements. A route can lose ships and hold volume, or the reverse.
Twenty-eight chokepoints are not world trade. They are the pinch points where satellite AIS gives a daily read. Traffic passing none of them is not in this index.
The record is vintage-dependent. These figures were computed on 12 August 2026 from PortWatch data through 9 August. PortWatch revises its history, and a reading recomputed next month may differ from the one published here.
What to watch
Whether the index holds above 10. Three days have ever done it, all of them in the past week. A fourth and fifth would make the level a state rather than a touch.
Hormuz’s share, against 3.80%. It sits at 0.21%. This is the single largest component of the record, and any recovery in the Gulf shows up here before it shows up in a price.
The 9.69 line. That was the peak of 17 March, and the index has been above it for ten days. Falling back under it would mark the August step as temporary; the chokepoint board carries the daily reading, and the last two years of daily readings are published as CSV.
Correction, 13 October 2026: An earlier version said the full history was published as CSV. The file holds the latest two years of daily readings (from 9 August 2024 when this piece was published); the series from 2019 that this piece’s counts rest on is not in it.