Kaub passed 2018's 104 days below low water on 25 October
The Rhine gauge at Kaub averaged below its 77 cm low-water mark on 109 days of 2026 to 29 October. No year in data from 2000 had as many; 2018 had 104.
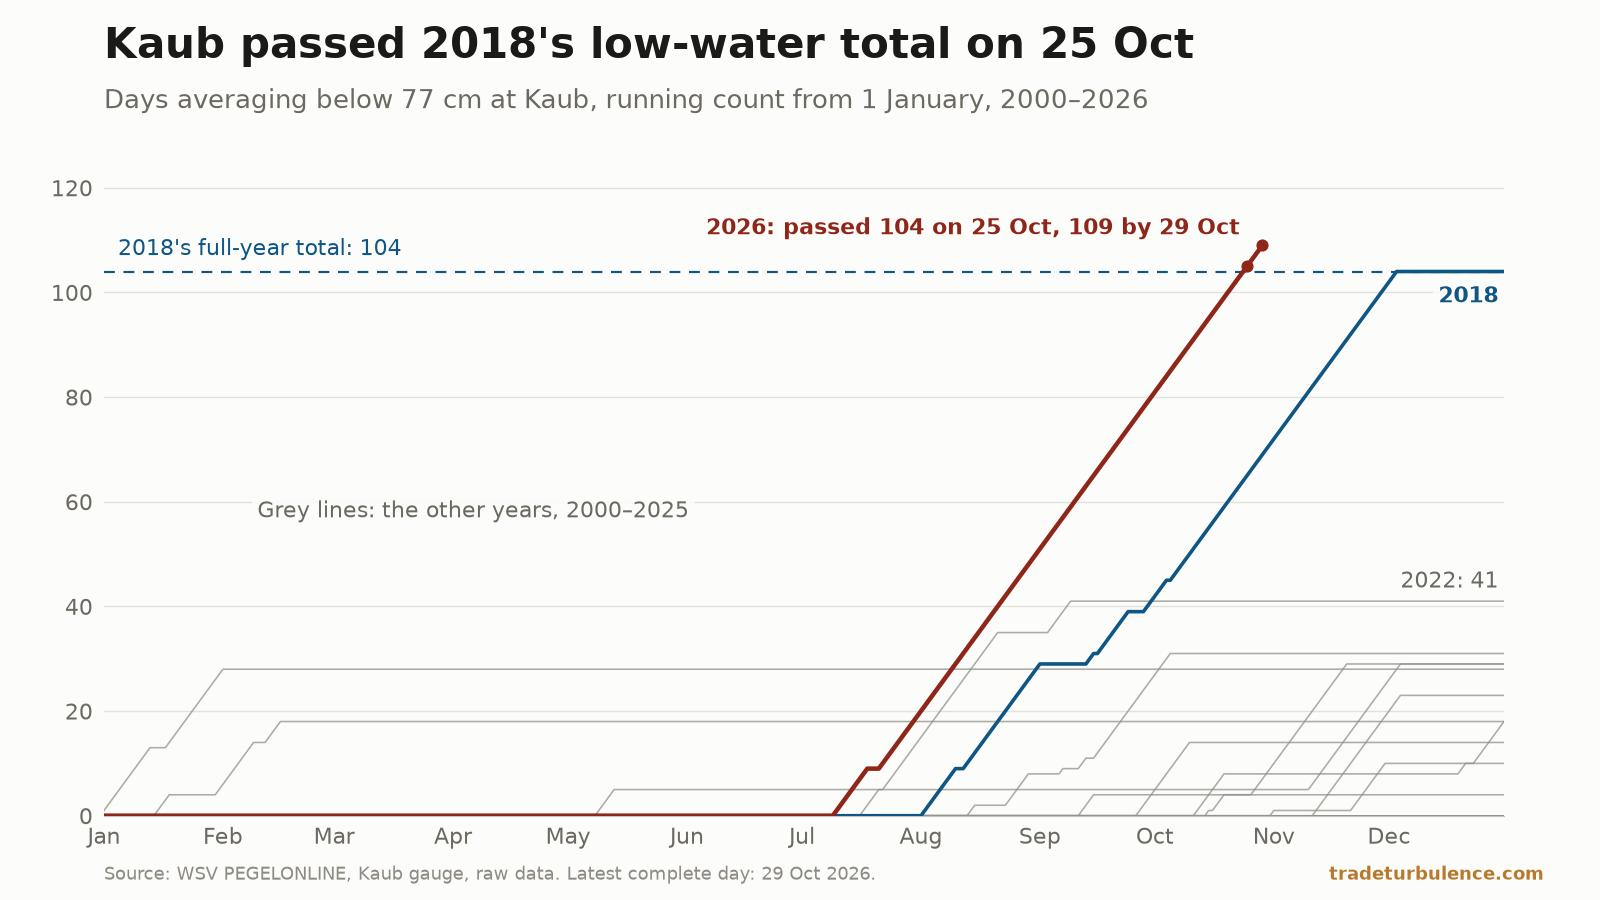
The Rhine gauge at Kaub averaged below its 77 cm low-water mark on 109 days of 2026 to 29 October. No year in the waterways agency’s raw data, which start in 2000, had as many; 2018 had 104. The last 100 of those days form one unbroken run, from 22 July; the longest run before it lasted 59 days. A late-October rise peaked at 61 cm, 16 cm short of the mark. The forecast the Federal Institute of Hydrology (BfG) issued at 07:00 CET on 30 October ends at 16 cm on 3 November, a point it labels an estimate.
109 days below 77 cm to 29 October, more than any year since 2000
Germany’s Federal Waterways and Shipping Administration (WSV) publishes an equivalent low-water level, GlW, as its reference low level for shipping. At Kaub, at Rhine kilometre 546, it is 77 cm, valid since 1 January 2023.
The counts here use the method of the site’s 11 October piece: the average of each local calendar day’s 15-minute readings, from the raw series WSV offers for download on its gauge page. That series starts on 1 January 2000 and, in the copy downloaded for this piece, runs to 21:00 CET on 30 October; 29 October is the last complete day. That piece set 25 October as the day 2026 would pass 2018’s 104 days below the mark, if no day reached 77 cm. None did: the highest daily mean from 11 to 29 October was 57.2 cm. The count reached 104 on 24 October and 105 on 25 October.
By 29 October it stood at 109. Only 12 of the 26 years from 2000 to 2025 had any day below 77 cm at all. After 2018 the highest counts were 41 in 2022 and 31 in 2003. By the same date in 2018 the gauge had spent 69 days below the mark.
The 2018 total depends on the rule. On unrounded means, the 11 October piece’s rule, it is 104; rounding each day’s mean to a whole centimetre gives 103, and counting days that round to exactly 77 gives 107. On every one of those rules 2026 has 109, and leads. Nor is the record an artefact of the calendar: the most days below the mark in any 365-day stretch before 2026 was 104, in the year to 3 December 2018, against 109 in the 365 days to 29 October.
A run of 100 days to 29 October. The longest before it was 59.
The gauge first averaged below 77 cm this year on 10 July, and did so on nine days before the run began. From 22 July to 29 October it did not average above it on any day: 100 consecutive days. The longest earlier run in the file is 59 days, from 6 October to 3 December 2018. The next longest are 30 days in the summer of 2022 and 25 in the autumn of 2015. If days whose mean rounds to exactly 77 cm are counted as below the mark, 2018’s longest run grows to 67 days, against this year’s 100.
The run is unbroken on daily means, not on every reading. Single 15-minute readings touched 77 cm twice inside it: for the first hour of 22 July, when they reached 78 cm before falling, and at two moments in the evening of 29 August. Neither day averaged as much as 71 cm. The highest daily mean of the run was 72.9 cm, on 31 August. The readings for 30 October, to 21:00 CET, did not go above 46 cm.
The late-October rise stopped 16 cm short
From 11 to 22 October every daily mean was between 8.8 cm, on 18 October, and 19.7 cm. Then the gauge rose: 25.9 cm on 23 October, a dip to 23.8 cm on the 24th, then 54.2 cm on the 26th and 57.2 cm on the 28th. The highest reading was 61 cm, first at 19:15 CET on 28 October — 16 cm below the mark the run is measured against. By 29 October the daily mean was back to 52.4 cm, and at 21:00 CET on 30 October the gauge read 36 cm.
The rise did move the 11 October piece’s second marker. On 23 October the daily mean was 25.9 cm. That ended a run of 36 days below 25 cm — the lowest level WSV lists for the gauge — that had begun on 17 September. The level fell back below it on 24 October, and every day from 25 to 29 October averaged above it. That leaves 2026 with 54 days under the 2018 record on daily means rounded to a whole centimetre, as WSV states the record and the 11 October piece counted; on unrounded means it is 55, adding 4 August at 24.96 cm. The file has none from 2000 to 2025. When read at 21:07 CET on 30 October, WSV’s gauge page still gave the record as 25 cm on 22 October 2018.
The honest context is that the rise took this year above 2018 on the same calendar days, for the first time since 1 September. From 25 to 29 October, the last complete days in this download, each daily mean was higher than on the same day of 2018: by 0.03 cm on the 25th, a tie on whole-centimetre means, and by at least 19.1 cm after it. Late October 2018 was that year’s lowest stretch: 28.6 cm on 23 October and 28.8 cm on the 28th. Over 1–29 October this year the gauge averaged 17.7 cm, against 46.6 cm on the same days of 2018. And 2018’s low water was not over: it had 35 more days below 77 cm after 29 October, the last on 3 December.
BfG’s forecast of 07:00 CET, 30 October, goes back under the 2018 low
The site’s outlook page carries BfG’s forecast for Kaub as BfG publishes it. The issue it carried at 21:07 CET on 30 October was made at 07:00 CET that morning, and it was BfG’s latest at source at that time.
The points the page showed started at 38 cm for 21:00 CET on 30 October, when the gauge read 36 cm, and none was higher. At source, the issue’s highest point was its first, 45 cm at 07:00 CET that morning. The points reach 24 cm at 05:00 CET on 1 November, under the 2018 record, labelled a forecast. From 09:00 that morning BfG labels them estimates, which the outlook page notes are less certain, and they end at 16 cm from 01:00 CET on 3 November. These are readings at given hours, not daily means, so they say nothing directly about the day counts. BfG issues a new forecast each morning, and a newer issue will replace this one on the outlook page.
One barge operator’s notice prices each step at or below 80 cm
The gauge data hold no tonnage, so the consequence has to be read from what operators publish. Contargo, a container barge operator, prices low water at Kaub for its terminals south of Koblenz. The standard table on its low-water page ends with a step for 90 to 81 cm, at €120 per laden 20-foot container and €165 per 40-foot, and a last row, “80 cm or below”, priced “By agreement”.
A customer notice on its site, undated by Contargo and read on 30 October, prices that range “until further notice”: €300 per laden 20-foot container at 71–80 cm, rising in 10 cm steps to €1,075 from 40 cm, and €380 to €1,280 for a 40-foot. “The increase in surcharges compared to previous low-water periods is largely due to the significant rise in ship charter costs,” the notice says. It also says Contargo’s transport obligation stops when Kaub is at 80 cm or less.
Contargo reads the level at 5 a.m. CET. On WSV’s readings at that hour Kaub was at or below 80 cm on every one of the 101 days from 22 July to 30 October, and never above 75 cm. On 30 October it read 45 cm, the figure Contargo publishes for the day. An undated update on the low-water page warns: “Should current forecasts materialize, it may become necessary to temporarily suspend our regular inland waterway services to the Upper Rhine, Middle Rhine, and Rhine-Main regions”. That is one operator’s price list and warning, not a market rate or a count of cargo.
What this cannot settle
These are raw readings. WSV publishes the downloadable series as unchecked data that may contain outliers and measurement errors. Counts near a threshold can move by a day when the data are validated. No reading shared by the 11 October and 30 October downloads has changed.
A record here is a record within WSV’s raw series from 2000. The day counts and run lengths cover only the downloadable file.
A day below the mark is a daily mean. Single readings reached 77 cm on 22 July and 29 August; on that stricter test the run would be shorter. WSV’s own checked daily values could differ by a centimetre near 77 cm, which is why the 2018 total is given as 103 to 107.
Earlier years are counted against the 77 cm in force since 2023. GlW was reset on 1 January 2023, and the level in force in 2018 may have differed. The gauge page gives the gauge zero as valid from 1 November 2019 without saying whether the scale itself moved then, and riverbeds shift, so the same level need not mean the same depth or flow as in 2018.
A gauge level is not a depth, and not a cargo. WSV’s help page says the level at a gauge tells you nothing about the local depth of water. The gauge page lists the maintained depth of the channel as 190 cm when the gauge reads 77 cm. Nothing here measures tonnes moved, freight paid or cargo shifted to rail and road.
What to watch
A daily mean of 77 cm. It would end the run, 100 days long on 29 October. The 29 October mean was 24.6 cm below it, and the reading at 21:00 CET on 30 October 41 cm below. BfG’s 30 October issue tops out at 45 cm.
25 cm, from 1 November. BfG’s 30 October issue goes under the 2018 record at 05:00 CET on 1 November. Each day that averages below it adds to the 54 counted to 29 October on whole-centimetre means, 55 on unrounded means.
3 December. The last day of 2018 below 77 cm; 35 of 2018’s 104 days fell after 29 October. It is the calendar the old record ran to, not a forecast for this year.
WSV’s listed record. The gauge page named 22 October 2018 when read at 21:07 CET on 30 October. A change there would be the agency confirming what the raw readings show.