The Rhine at Kaub has spent 41 days below its 2018 record
The Kaub gauge averaged 7.8 cm on 10 October, its 41st day of 2026 below the 25 cm low of 2018. From 2000 to 2025, no day in the agency's data was under it.
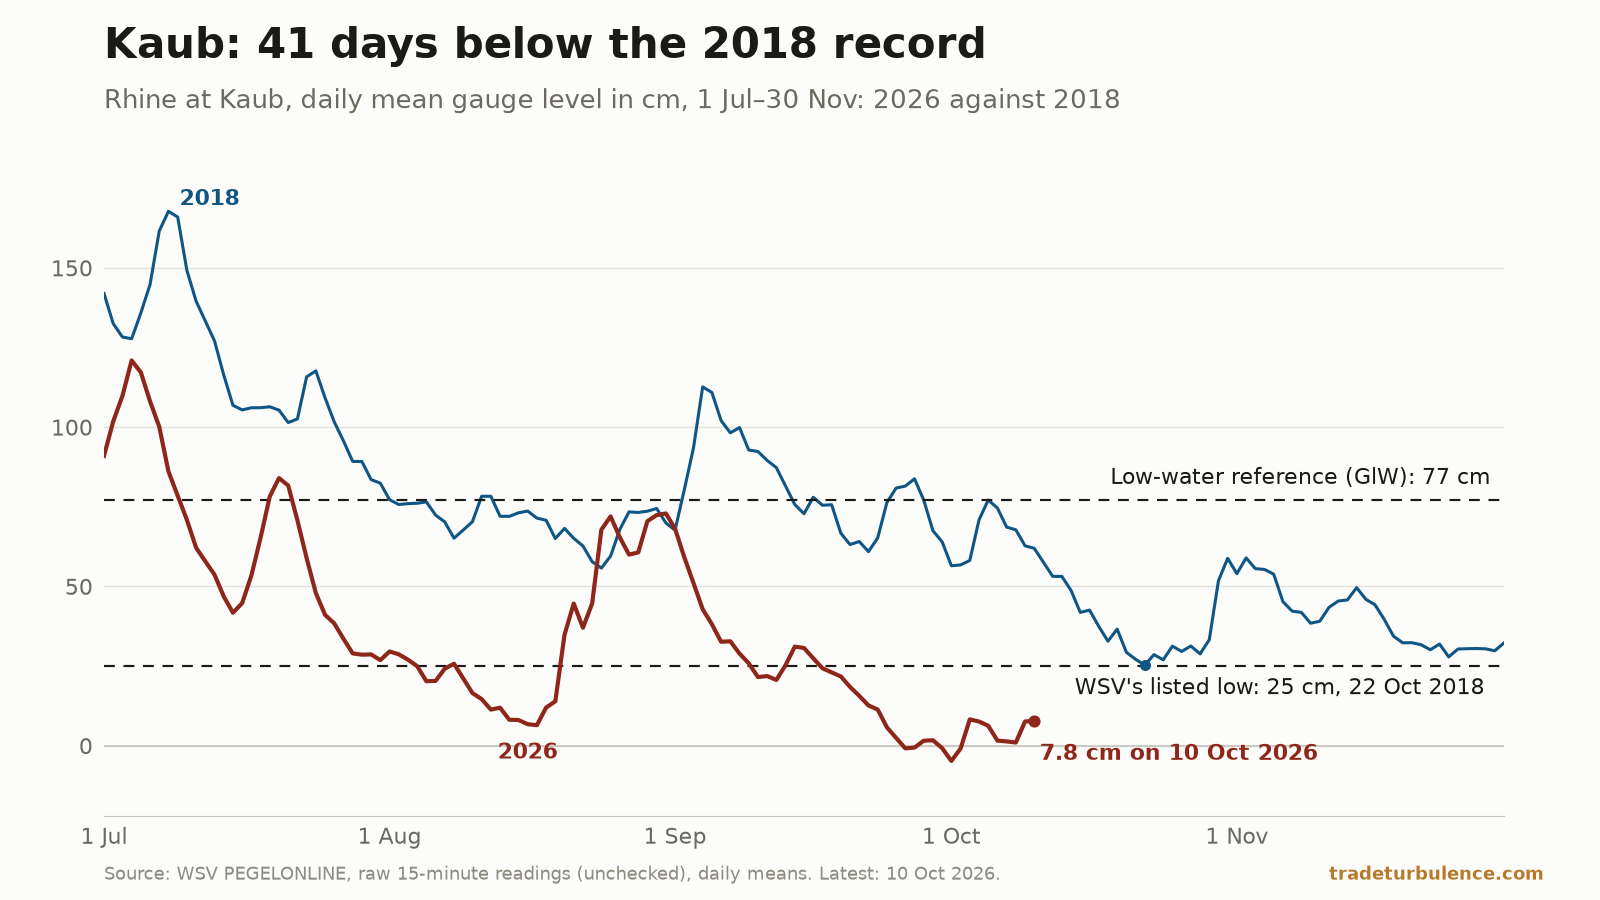
The Rhine gauge at Kaub averaged 7.8 cm on 10 October 2026. It was the 24th day in a row, and the 41st this year, below 25 cm — the lowest level Germany’s waterways agency lists for the gauge, set on 22 October 2018. In the agency’s data from 2000 to 2025, no day was under that mark. On five days the average sat below the gauge’s own zero. And 2026 already has 90 days under the 77 cm low-water reference, against 50 by the same date in 2018. The Stress Index (v3) read 82.5, Severe, on 8 October.
Forty-one days under a level that had stood since 2018
Kaub, at Rhine kilometre 546, is a reference gauge for the river above Koblenz: one barge operator prices low water for every terminal south of that city off it. Its gauge page , published by the Federal Waterways and Shipping Administration (WSV), lists the gauge’s lowest known level, which it labels NNW, as 25 cm on 22 October 2018. WSV’s help page defines that figure as the lowest known daily mean, so the comparison here is made the same way: the average of each day’s 15-minute readings, from the raw series WSV offers for download, which starts on 1 January 2000.
That file reproduces the record. Its lowest day before this year is 22 October 2018, at 25.28 cm. From 2000 to 2025 it contains 9,497 days and none below 25 cm.
This year it contains 41. The first was 5 August. The level rose back to 25 cm or above three times — for a day on 8 August, for three weeks from 20 August, when it reached 72.9 cm on the 31st, and for four days from 13 September. The current run began on 17 September: 24 consecutive days to 10 October. Counting 4 August, whose mean was 24.96 cm and rounds to the record itself, would make it 42. At 13:00 local time on 11 October the gauge read 15 cm, a raw reading from a day that is not yet complete.
VerkehrsRundschau, reporting dpa on 4 August , cited the Rhine waterways office saying the level had fallen to 24 cm, one centimetre under the 2018 mark. The gauge page still shows 25 cm and the 2018 date. All of these readings are raw and unchecked.
The gauge has read below its own zero
The August low was a daily mean of 6.4 cm on the 17th. Late September went through it. At 19:30 on 25 September the gauge returned its first negative reading; the file has none before 2026. There are now 403 quarter-hour readings below zero, the last at 07:00 on 8 October. The lowest is −6 cm, first reached at 02:45 on 1 October. The mean for that day was −4.8 cm, 29.8 cm under the 2018 record, and four other days averaged below zero: 26, 27 and 30 September and 2 October.
A negative level does not mean a dry river. A gauge level is a height above a fixed zero mark on the gauge, and WSV’s help page says it tells you nothing about the local depth of water. The same gauge page lists the maintained depth of the shipping channel as 190 cm when the gauge reads 77 cm. Simple subtraction from those two numbers puts the channel at about 121 cm at the 10 October mean, against 138 cm at the 2018 low. That is arithmetic on WSV’s published figures, not a sounding of the riverbed.
2026 has 90 days below the low-water mark. 2018 had 50 by now.
WSV’s reference low level for shipping is the equivalent low-water level, GlW: 77 cm at Kaub since 1 January 2023. For scale, the gauge’s mean level over November 2010 to October 2020 was 208 cm.
By 10 October, 90 days of 2026 had a daily mean below 77 cm. By the same date 2018 had 50, and 2022 had 41, which was all it would have. These counts use unrounded daily means; on means rounded to a whole centimetre, the rule used for the 25 cm count, they are 90, 49 and 40. In 14 of the 26 complete years from 2000 to 2025 there was no such day at all.
The current run below 77 cm is 81 days, from 22 July. The longest in the earlier data was 59 days, from 6 October to 3 December 2018. On 98 of the 102 days since 1 July, this year’s level was below the same day of 2018. September averaged 23.1 cm; September 2018 averaged 81.2. On 10 October 2018 the gauge averaged 61.9 cm, which is 54.1 cm above this year’s reading for the day.
The honest context is that 2018 is still ahead on the full-year count. It finished with 104 days below 77 cm, and 54 of them came after 10 October. Its low water ran from 2 August to 3 December. This year’s first day below the mark was 10 July. Whether 2026 ends above 2018 depends on weeks that have not happened.
A barge operator’s price list stops at 80 cm
The gauge data holds no tonnage, so the consequence has to be read from what operators publish. Contargo, a container barge operator, prices low water at Kaub in five steps for terminals south of Koblenz. The last priced step, 90 to 81 cm, adds €120 to a laden 20-foot container and €165 to a 40-foot one. The table’s last row reads “80 cm or below”, priced “By agreement”.
Contargo takes the level at 5 a.m. Central European Time. On that measure Kaub has been at or below 80 cm on 93 days this year to 11 October, and on every one of the 82 days since 22 July. The same page carries the heading “Navigation does not stop, but becomes uneconomical”.
Logistik Heute, reporting dpa on 30 September , quoted the barge owners’ association BDB saying only isolated cargo vessels were still running between St. Goar and Mainz, with far less cargo aboard. That is a report, not a count. No public daily series shows how much cargo passes Kaub.
The forecast is the agency’s, and its first point was 7 cm low
The site’s outlook page carries the Kaub forecast of the Federal Institute of Hydrology (BfG). The one published there as this was written was issued at 07:00 on 10 October. It put the gauge at 9 cm at 07:00 on 11 October; the gauge read 16 cm. Its last point, which BfG labels an estimate rather than a forecast, is 14 cm at 07:00 on 14 October. The forecast has been reissued each morning, and the page shows the latest with its issue time.
A 7 cm miss is small on a river whose mean is 208 cm. It is large against the 17.2 cm that separated the 10 October mean from the 2018 record.
The Stress Index’s supply chains pillar read 99.2 on 8 October, and the headline 82.5 is higher than every day of 2010–2019. None of the index’s inputs is a river gauge, as its methodology sets out. The Rhine is not what that reading measures.
What this cannot settle
These are raw readings. WSV publishes the series as unchecked data that may contain outliers and measurement errors. Counts near a threshold can move by a day when it is validated: 41 or 42 days below 25 cm, and between 103 and 107 for 2018’s days below 77 cm, depending on how days that round to exactly 77 are treated.
A record here means the lowest in what WSV lists. The 25 cm figure is the lowest daily mean WSV knows of. The day counts cover only the downloadable series, which starts in 2000.
The gauge is not guaranteed to be the same ruler as in 2018. The gauge page gives its zero as 67.669 m above the German height datum, valid from 1 November 2019. The page does not say whether the scale itself moved then or only the height system it is expressed in. WSV lists the 2018 level beside today’s readings with no adjustment noted. Riverbeds also shift, so the same level need not mean the same depth or flow as eight years ago.
Earlier years are counted against today’s 77 cm. GlW was reset in 2023; the level in force in 2018 may have differed.
Level is not cargo. Nothing here measures tonnes moved, freight rates or what was diverted to rail and road.
What to watch
25 October. If every day from 11 October stays below 77 cm, 2026 ties 2018’s 104 days on 24 October and passes it the next day. One day above 77 cm moves that date back by one.
A daily mean of 25 cm. It would end the run that began on 17 September. The 10 October mean needed 17.2 cm to get there, and the 11 October readings so far are higher than the day before.
77 cm. That is 69.2 cm above the 10 October mean. In 2018 the gauge did not stay above it until after 3 December.
WSV’s listed record. The gauge page still names 22 October 2018. A change there would be the agency confirming, on checked data, what the raw readings show.