Malacca peaked in January. The Red Sea never moved it.
Malacca's busiest month on record was January 2026. It sits 23% above a baseline that contains the pandemic, and 3.5% below its own trailing 12 months.

The Malacca Strait carried 245.0 transits a day in January 2026, the busiest of the 91 months in this record. Through 26 July it is running at 224.0, which the chokepoint board reports as 23.1% above baseline and 3.5% below its own trailing year. Both figures are correct, and nothing in the first one is recent. The Stress Index reads 45.7 — Normal.
January was the busiest month in ninety-one
Daily transit calls, derived from IMF PortWatch satellite AIS counts, run to 26 July. Measured over identical 26-day windows, so that no partial month is set against a full one, 2026 reads:
| Month, 1st–26th | Transits a day |
|---|---|
| January | 246.6 |
| February | 237.6 |
| March | 221.1 |
| April | 220.5 |
| May | 218.8 |
| June | 219.7 |
| July | 224.0 |
The fall is concentrated in a single month. Weekly means go from 239.1 in the week to 1 March to 204.7 in the week to 29 March, then back to 217.1. Since then the route has held between 218.8 and 224.0, and July is the highest of the five months that followed.
Part of that decline is ordinary. Across 2019 to 2025 the same January-to-July comparison averages −2.3%, with a standard deviation of 6.0. This year is −9.1% — about one standard deviation beyond the usual. January is only the third busiest calendar month on the 2019–2025 average, and the spread from busiest to quietest runs 204.5 down to 191.6, so there is not much season in this series to begin with. The peak is real. A continuing unwind is not what the data shows.
The Red Sea closed and this route did not move
If the Red Sea diversion pushed traffic onto this route, the series does not show it. Six months either side of the first attacks in December 2023:
| Route | Before | After | Change |
|---|---|---|---|
| Bab el-Mandeb | 75.5 | 39.3 | −47.9% |
| Suez Canal | 74.1 | 47.1 | −36.5% |
| Cape of Good Hope | 52.6 | 78.9 | +50.1% |
| Malacca Strait | 221.8 | 221.9 | +0.0% |
The Cape gained 26.3 transits a day against Bab el-Mandeb’s loss of 36.2. Malacca moved by a tenth of one. Changing the window does not change the answer: at three months either side Malacca reads +0.3%, at nine months +0.7%, at twelve +2.0%, while the Cape runs from +34.2% to +75.7% across the same windows. The Indonesian alternatives did nothing either — Sunda +4.2%, Lombok −0.2%.
Why is not answerable from a transit count. What the count settles is that whatever Malacca’s elevation is, the Red Sea did not cause it.
None of the 23% is recent
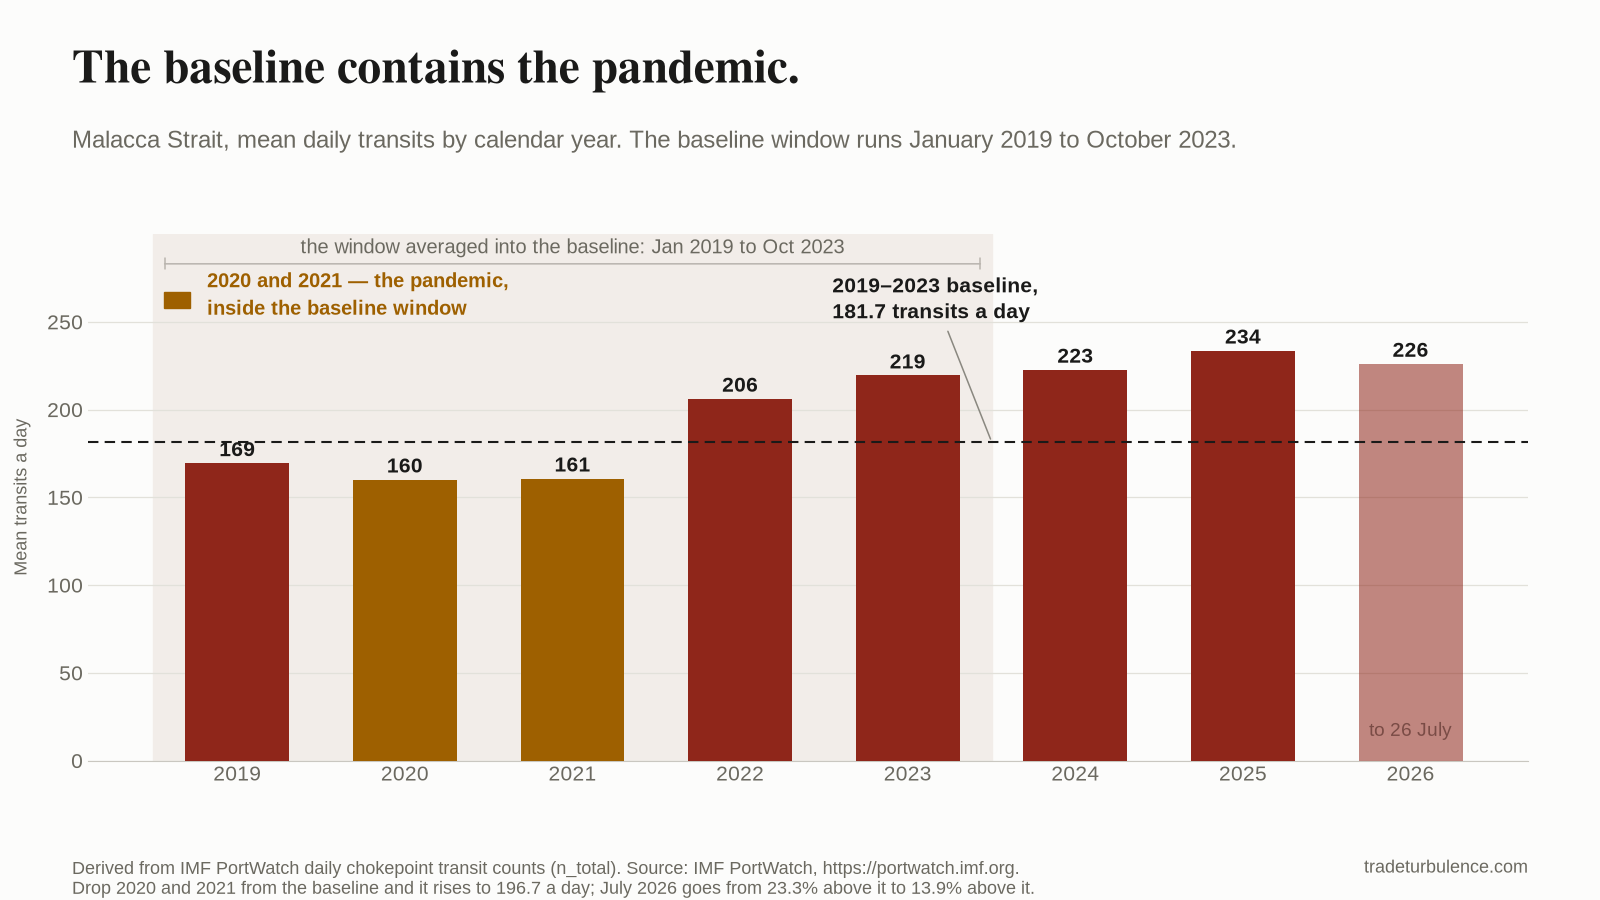
That 23% is measured against 181.7 transits a day, the mean of 1,765 days from 1 January 2019 to 31 October 2023. The window contains 2020 and 2021, when Malacca averaged 160.1 and 160.7. Drop those two years and the baseline rises to 196.7, which turns July’s +23.3% into +13.9% — so the pandemic accounts for about two-fifths of the gap, not most of it.
The other three-fifths is older still. Malacca stepped up in late 2021, the monthly mean going from 146.6 in October to 191.3 in November, and it has not printed a month below 191 since. Against the part of the baseline window that follows the step — January 2022 to October 2023, at 211.6 a day — July 2026 is +5.9%.
Against later references, the same July figure reads differently:
| Reference | Level | July 2026 |
|---|---|---|
| 2019–2023 baseline | 181.7 | +23.3% |
| Calendar 2023 | 219.4 | +2.1% |
| Calendar 2024 | 222.7 | +0.6% |
| Calendar 2025 | 233.6 | −4.1% |
| Trailing twelve months | 231.6 | −3.3% |
The board publishes both readings for this reason: +23.1% against the pre-disruption baseline, −3.5% against the trailing year. The elevation is four years old. The change is not.
What this cannot settle
Why March fell. It coincides with the week the Strait of Hormuz stopped, and a transit count cannot separate coincidence from consequence. Nothing here identifies a cause for the fall or for the flat five months after it.
Which baseline is the right one. Keeping 2020 and 2021 makes every route look busier than it is; dropping them discards two real years of shipping. Both choices are defensible and neither is neutral. Quoting one number without the other is what fails.
What the hulls carried. Capacity moved with the count rather than against it: 8.79m deadweight tonnes a day in July, 26.6% above the same baseline against 23.3% on the count. Deadweight is nominal capacity, not cargo loaded.
What to watch
Whether 224.0 survives the month. Twenty-six of July’s 31 days are in. At that level July is the highest month since February, and the remaining five days decide whether that is a turn or a rounding.
Whether the count clears 231.6. That is the trailing-year mean, and the level at which the board’s two readings would stop pointing in opposite directions.
Malacca’s share of chokepoint traffic. It has gone from 9.14% in the baseline window to 11.95% in July, against a Route Displacement Index of 9.69 versus a 3.85 baseline mean. The network is still running a tenth of its traffic on different routes than it did before 2024, and Malacca’s share is part of that arithmetic whether or not the Red Sea ever moved it.