The Kerch Strait broke 107 days before the invasion
Kerch Strait transits fell to 3.1 a day in July 2026, in what is normally its busiest season. The daily series broke on 9 November 2021, not in February 2022.

Traffic through the Kerch Strait, the only sea entrance to the Sea of Azov, fell to 3.1 vessels a day in July 2026 — in a month that normally runs 20% above its annual average. Russia suspended transit applications on 10 July after Ukrainian drone attacks on shipping. But the largest single break in seven and a half years of satellite records is not dated 2022 or 2026. It is dated 9 November 2021, 107 days before the invasion, and the strait has never been near normal since.
Three ships a day, at the top of the season
Kerch averaged 11.2 transits a day in June and 3.1 in July (1–26 July), derived from IMF PortWatch satellite AIS counts. Taken alone that is a 72% fall in a month. Taken against the calendar it is worse.
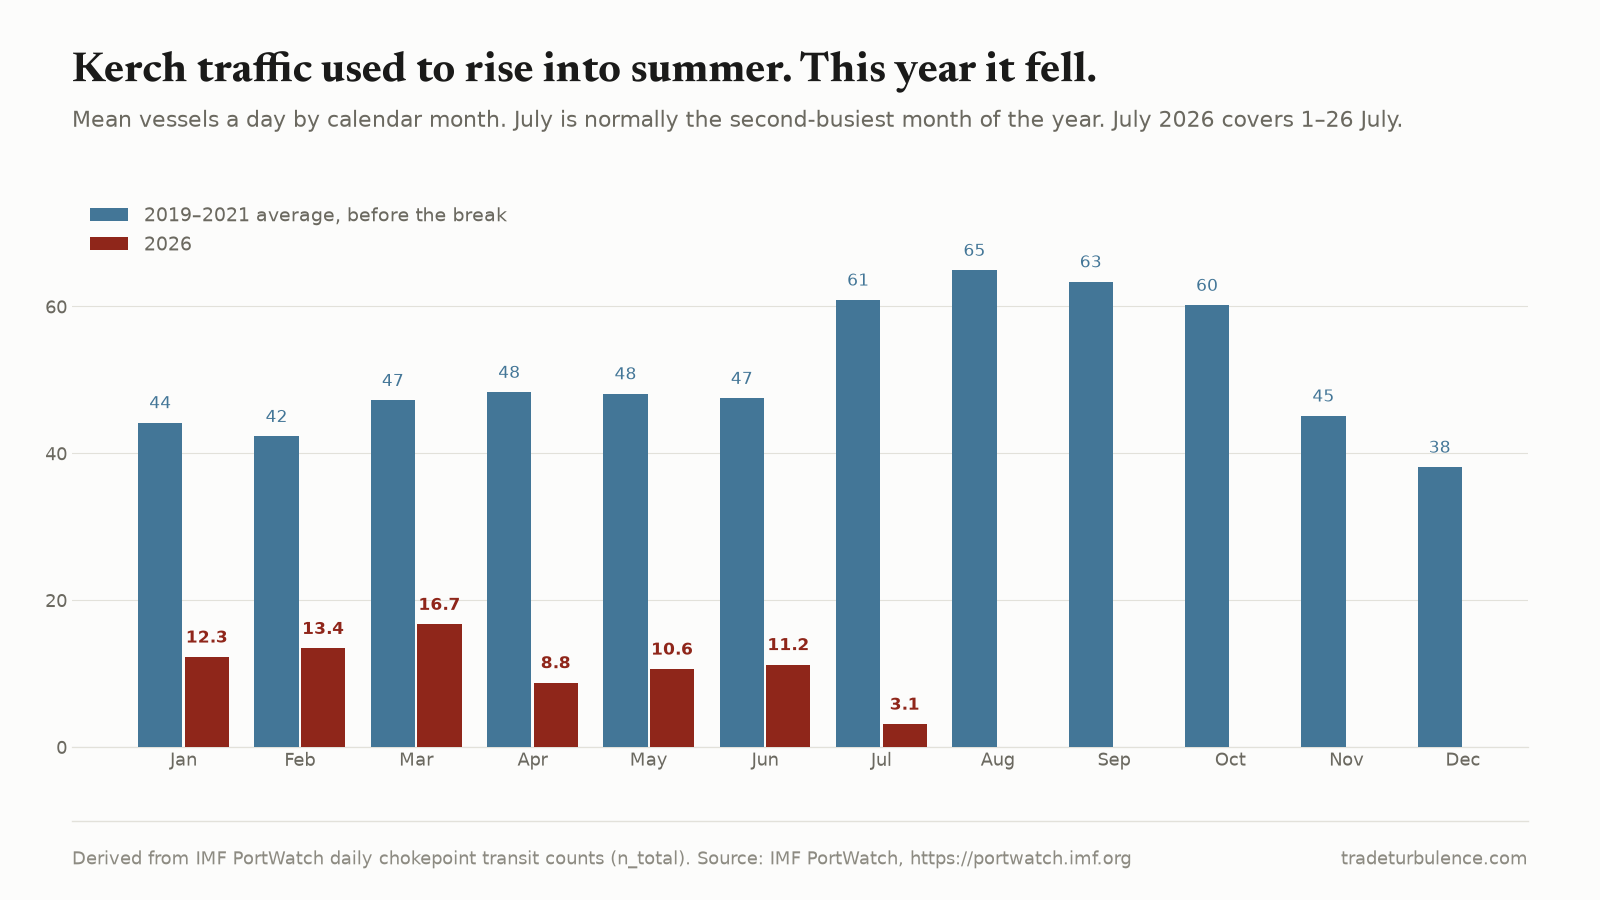
This route has a pronounced season. Across 2019–2021 it carried 47.5 vessels a day in June and 60.9 in July — the summer months are when Azov grain moves, and July normally runs about 28% above June. Applying that ordinary seasonal step to this June’s 11.2 gives an expected July of 14.4. The observed 3.1 is 78% below what the season alone would predict, and 95% below the July norm of the pre-break years.
The month splits cleanly on a date. Russia’s border guards told shipping companies they would stop accepting applications for passage through the Kerch Strait from 18:10 local time on 10 July, with no date given for resumption. Ukraine said it damaged 28 Russian vessels in the Sea of Azov, 21 of them tankers, in an operation reported overnight on 11 July (Reuters, via the Kyiv Independent). The two are usually reported together, but the notice is dated before the strike, and this piece does not assert which produced which. The transit series splits at the suspension:
- 1–9 July: 5.8 transits a day
- 10–26 July: 1.7 a day, with five days of the seventeen recording none at all
The break is dated 9 November 2021
The daily series shows one discontinuity larger than any other, and it is not where the narrative would put it.
| Window | Transits/day |
|---|---|
| 30 days to 8 November 2021 | 58.3 |
| 30 days from 9 November 2021 | 18.4 |
A 68% fall across a single date, from a level that had been ordinary all autumn. October 2021 averaged 49.9 a day. The week of 29 October to 4 November ran 54, 54, 50, 48, 57, 54, 66. The following week opened 37, 50, 61, 41 — and then 14, 6, 14.
Kerch does have a winter season, so the timing invites a seasonal explanation. It does not survive one. November averages 44.7 in 2019 and 63.0 in 2020 against 27.5 in 2021; December runs 54.7 and 41.8 against 17.8. The ordinary November dip is about 11% below the annual mean. What happened in 2021 was 49% below the two Novembers either side of it, and December was 63% below.
That is 107 days before 24 February 2022. What produced it is not a question a transit count can answer, and this piece does not assert a cause — a widely circulated report of Russia barring foreign-loaded vessels from the Azov is dated November 2022, a year later, and does not explain this. What the data establishes is the date, and the date is not the one the story is usually told around.
The invasion is not the largest discontinuity in this series
The invasion is visible, and it is smaller. Kerch averaged 20.3 transits a day over 1–23 February 2022 and 9.6 from 24 February to the end of March — a real fall, but from a level that had already halved three months earlier.
What followed is the part that gets lost in a streak. Traffic recovered through 2022, reaching 29.4 a day that August. It then decayed across 2023 and collapsed in 2024 to a trough of 0.33 a day in September 2024 — 142 days that year recorded no transit at all. Then it recovered again, to 20.7 a day in October 2025, sixty-two times the trough. And now 3.1.
Level and direction tell opposite stories here, and only reading both gets it right. The level has round-tripped twice. The deficit against normal has never closed once.
The streak is real, but not in the way it sounds
The chokepoint board reports Kerch running more than 15% below baseline for 1,703 consecutive days, since 27 November 2021 — the longest run on the board. That figure is computed on the 30-day average, not on daily counts, and the distinction matters: on the raw daily series there have been 77 days at or above that threshold in the same window, most recently 18 May 2026, when 50 vessels transited. The strait has had good days. It has not had a good month.
One further caveat belongs on the published number rather than buried. The board measures every route against a common 2019-01-01 to 2023-10-31 baseline, chosen to end before the Red Sea attacks. For Kerch that window contains two years of Kerch’s own disruption, which drags the baseline down to 37.4 a day. Measured against the level that actually preceded the break — 52.6 a day up to 8 November 2021 — July is not 92% below normal but 94% below it. The published figure is the conservative one.
The Black Sea is narrowing at both ends
Of the 28 routes on the chokepoint board, Kerch is the second-worst performer this July, down 76.5% year on year. The worst is the Strait of Hormuz. Third is the Bosporus.
| Route | Jul 2025 | Jul 2026 | y/y | vs 2019–23 baseline |
|---|---|---|---|---|
| Kerch Strait | 13.3 | 3.1 | −76.5% | −91.7% |
| Bosporus Strait | 91.3 | 73.3 | −19.7% | −24.5% |
The Bosporus number is the one to sit with. Its 30-day average of 74.5 vessels a day is the lowest reading in the entire series since it begins in 2019 — no day in seven and a half years is lower. Kerch is not at its own record low: it went lower in 2024. But the two straits that bound the Black Sea are both far below normal in the same month, one of them for the first time ever.
Nothing downstream absorbed the difference. Kerch and the Bosporus together lost 28.1 transits a day year on year, and the routes that Black Sea export cargo would have to use are all down too: Gibraltar −9.2 a day, Dover −12.6, Øresund −7.7. Suez managed +3.7. The largest gains anywhere on the board are Luzon +23.2 a day, Mindoro +23.0 and the Yucatan Channel +9.5 — Southeast Asia and the Caribbean. No Black Sea cargo reaches any of them by being rerouted.
The stakes are agricultural rather than energetic. Market analysts cited by Reuters put up to a quarter of Russian wheat exports through the Sea of Azov; September wheat futures on Euronext rose nearly 4% on 10 July to a six-week high (UkrAgroConsult). The Stress Index reads 47.2 as of 28 July — Normal — and carries no agricultural input at all, so it will not register this through any channel except the dollar.
What this data cannot settle
At Kerch, use the transit count and not the tonnage. The deadweight series carries outliers this route cannot physically support: two days in July show a single transit at around 100,000 dwt through a shallow, air-draft-limited canal. Five days supply 83% of the month’s recorded tonnage. Strip them and the average vessel is 1,588 dwt, against a 1,934 dwt median across the record — a coaster route, unchanged. Any claim that the ships got bigger is an artefact of four or five days.
It cannot say why November 2021 happened, and it cannot say why the Bosporus is at a record low either. A transit count establishes when and how much, never why.
An AIS count cannot see a vessel with its transponder off — a live concern on a route where the traffic under attack was described as shadow-fleet tankers. These figures are a floor.
A transit count cannot see congestion. Ships waiting are invisible; the series counts what moved. Reports of loaded vessels unable to sail and grain intake suspended at Azov, Rostov-on-Don and Taganrog come from regional and industry sources (UkrAgroConsult), not from this dataset, and are not independently verified here.
What to watch
Whether daily transits clear 20 again. That was the October 2025 level, and it is the marker separating a suspension from a closure. The strait has recovered twice before from lower.
The Bosporus 30-day average, now 74.5 and at a record low. Kerch closing is a Russian and Ukrainian event. The Bosporus falling with it is a Black Sea event, and it reaches Romanian, Bulgarian, Georgian and Turkish trade alongside Russian.
A resumption notice from Russia’s border guards. The 10 July suspension was issued without an end date. Its withdrawal would be observable, and would appear in transit counts within days rather than in trade statistics months later.