Four staple crops last rose this much together in February 2021
Wheat, maize, soybeans and rice each cost at least 21% more in September 2026 than a year earlier, World Bank data show. That last happened in February 2021.
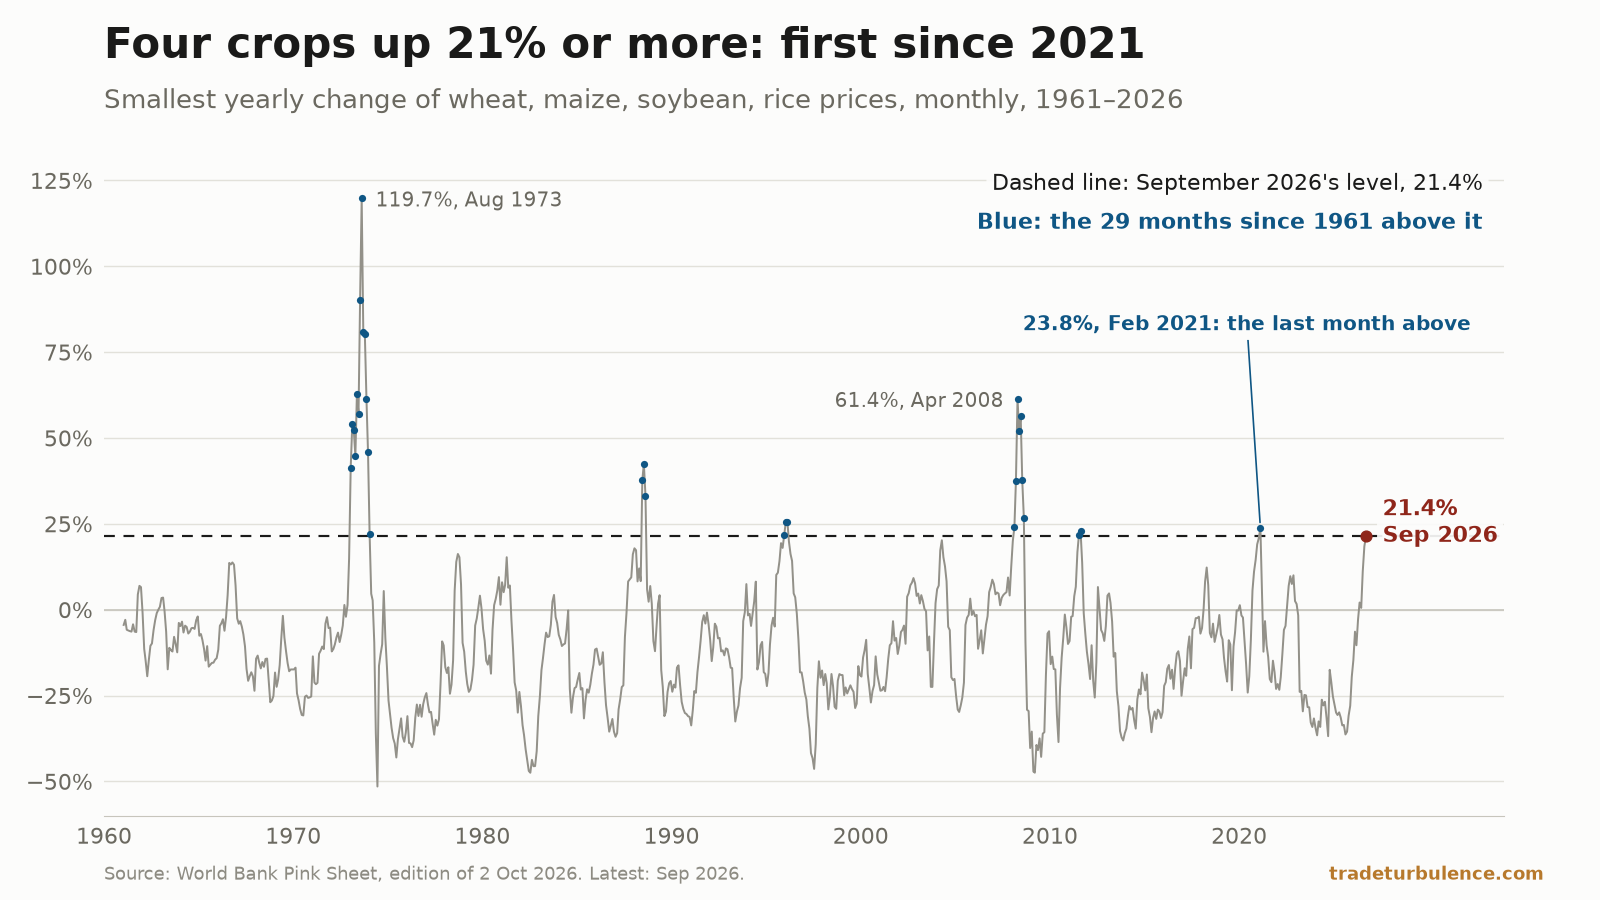
Wheat, maize, soybeans and rice all cost more in September 2026 than a year earlier, by 48.4%, 21.4%, 29.7% and 28.9%, in the World Bank’s monthly prices of 2 October. Even the smallest of the four, maize’s, was large by recent standards: no month since February 2021 had all four up by as much. Of 789 months since 1961, 29 had all four up by more. Wheat and rice are a long way from their nominal records in data from 1960: wheat is 33.6% below May 2022’s, rice 46.9% below April 2008’s.
In no month since February 2021 had all four risen as much
The prices are monthly averages in nominal US dollars a tonne, from the World Bank’s Pink Sheet of commodity prices, published on 2 October, with averages to 30 September; the next edition, with October’s, is due on 3 November. Three are export prices at the US Gulf and one at Bangkok, in the World Bank’s own words: wheat is US “no. 2 hard red winter Gulf export price”; maize US “no. 2, yellow, f.o.b. US Gulf ports”; soybeans, since January 2025, “U.S. Soybeans, FOB U.S. Gulf”; rice Thai “5% broken, white rice”, f.o.b. Bangkok. All four series start in January 1960.
| Price, $ a tonne | September 2025 | September 2026 | Change |
|---|---|---|---|
| Wheat, US hard red winter | 233.8 | 347.0 | +48.4% |
| Soybeans, US Gulf | 404 | 524 | +29.7% |
| Rice, Thai 5% | 374 | 482 | +28.9% |
| Maize, US Gulf | 197.4 | 239.6 | +21.4% |
A rise is only as broad as its smallest part, so this piece ranks each month by the smallest of its four yearly changes, with no threshold to pick. In September that was maize’s 21.4%. From January 1961, the first month with a year-earlier price for all four, there are 789 months to rank. Twenty-nine had a larger smallest rise, which puts September 30th. The last of them was February 2021, when the smallest of the four was rice’s 23.8%. In the 66 months between, no month had all four up by 21.4% or more.
The ranking survives two checks. Deflated by US consumer prices, which rose 3.74% in the year to September, the smallest real rise is 17.0% on our calculation, and February 2021 is again the last month with a larger one. The International Monetary Fund’s own benchmark prices, which FRED republishes with the IMF’s permission, show maize up 20.8% on the year, soybeans 30.7%, Thai rice 33.6%, and a different wheat price up 59.1%. On those four, which can all be compared from May 2011, only January and February 2021 had a larger smallest rise.
Eight times since 1961 all four rose by more than a fifth
Counting months over a line gives the same last date, but only up to a point. All four were up more than 20% on the year in 33 of the 789 months, in eight episodes: 1973, ending in January 1974; June–August 1988; December 1995–February 1996; April 2004; January–August 2008; July–August 2011; January–February 2021; and September 2026. Before September, the last was February 2021.
At 15%, there are 48 months in ten episodes, and the current one, which began in August, is the first since February 2021. At 25%, there are 23 months in four episodes, the last ending in August 2008, and September 2026 is not one of them: maize falls short. That is why the headline rests on the smallest rise rather than on a line.
By that measure the current episode is mild. Of the seven earlier episodes over 20%, six went further. The smallest of the four rises peaked at 119.7% in August 1973, 61.4% in April 2008 and 42.5% in July 1988; February 2021’s 23.8% and August 2011’s 22.9% were closer. Only April 2004, at 20.2%, stopped lower. Eight episodes in nearly 66 years make a joint rise a recurring event, not a rare one; a month as broad as September, 30th of 789, is less common.
Alone, only wheat’s rise ranks near the top
Taken one at a time, only wheat’s rise is high in its own history. Its 48.4% was beaten in 45 of the 789 months, close to the 29 for the smallest of the four, though it was last exceeded as recently as June 2022. Maize’s 21.4% was beaten in 132 months and last in November 2022; rice’s 28.9% in 99, last in December 2023; soybeans’ 29.7% in 85.
Indices that average the grains show the same. The World Bank’s own grains index, which weights maize, rice, wheat and barley and leaves out soybeans, rose 29.5% on the year, a rise last exceeded in April 2022. The FAO Cereal Price Index of the UN’s Food and Agriculture Organization averaged 122.8 points, 17.2% above September 2025, a rise last exceeded in June 2022. What sets September apart is the size of the joint rise: all four up 21% or more at once.
Part of the rise is a rebound from 2025’s lows
A yearly change depends on where it starts, and September 2025 was low. Rice’s $374 that month was its lowest since March 2017. Rice is still 16.9% below September 2024’s $580, and below June 2026’s $494. Wheat’s August 2025 average, $231.1, was its lowest since August 2020.
The levels are well short of the records, in a series from 1960. Wheat is at its highest since May 2023, 33.6% below its May 2022 record of $522.3. Maize is at its highest since July 2023, 31.2% below April 2022’s $348.2. Rice is 46.9% below its April 2008 record of $907. Soybeans are at their highest of the 21 months since the World Bank moved its soybean price to the US Gulf in January 2025; their earlier records are on another definition, so they are not compared here.
The site’s 19 October piece found that a tonne of DAP fertiliser cost 2.31 tonnes of wheat in September. No prices have been published since: the World Bank’s workbook is the same file, so that ratio and wheat’s $347.0 stand until 3 November.
FAO links wheat and maize to the Black Sea, and maize to US yields
On food, the World Bank’s note on its September prices says only: “The non-energy index edged up 1.3%, with food prices rising 3.8% and fertilizers increasing by 0.4%.” It gives no reason for the grains, and its October Commodity Markets Outlook was not yet out on 24 October. The FAO, in its 2 October release, gave reasons for three of the four.
For wheat it wrote: “The rise was largely associated with logistical constraints in the Black Sea region, which prompted importers to shift towards alternative origins. Dry weather conditions in parts of North America ahead of winter wheat planting also contributed to the increase”. By its measure, world wheat prices reached “their highest level since August 2023”; the US hard red winter price is at its highest since May 2023.
For maize, it cited “a tightening supply outlook following lower-than-anticipated yields in the United States of America and less export availability in Brazil”. It added: “Trade disruptions in the Black Sea region reduced maize export availability, while uncertainty over shipping through the Strait of Hormuz kept concerns about fuel, fertilizer and freight costs elevated, providing additional support to commodity prices, particularly for those used as biofuel feedstocks, such as maize.” For rice, it said its All Rice Price Index rose 1.4% in September “as Indica quotations rose amid weather concerns and seasonally tighter supplies”.
That is the FAO’s account of September. Neither it nor the World Bank gives one for soybeans, and the prices themselves do not say why any of the four moved.
What this cannot settle
These are export prices at the US Gulf and Bangkok, in nominal dollars. They are not what importers, millers or shoppers pay: freight, currencies, taxes and local margins sit between them.
The series have changed definition. Wheat’s grade changed after June 2020; soybeans’ series changed in December 2007, January 2021 and January 2025. September’s yearly changes compare like with like. The February 2021 comparison crosses the wheat and soybean changes, but the IMF’s series also put the last broader rise in January–February 2021.
The date depends on the wheat benchmark. With the World Bank’s US soft red winter wheat, up 34.6% on the year, in place of hard red winter, September’s smallest rise is unchanged, but the last month with a larger one is June 2008, in data from 1980: soft red winter rose 15.7% in the year to February 2021. This piece, like the site’s wheat page, uses hard red winter. The result also depends on the rice benchmark: the World Bank’s “Rice (Vietnam), 5% broken” price, a “Minimum Export Price, f.o.b. Hanoi” in a series from December 2003 with 11 months missing, rose 12.65% in the year to September, which would make September’s smallest rise 12.65%, beaten as recently as April 2021.
The episodes are a counting choice. Runs of months no more than a year apart are counted as one episode; the counts of months do not depend on that.
It is one month, and it can be revised. All four have been above 20% for one month and above 15% for two. This edition’s own comparison sheet shows July’s soybean price at $478 against $459 in an earlier upload.
What to watch
3 November. The World Bank’s next prices, for October. To stay more than 20% above October 2025, at the precision the World Bank prints, maize must average $237.8 or more; September’s $239.6 is $1.8 above that. Soybeans need $485, rice $428 and wheat $277.0. The same release tests the 19 October piece: with DAP unchanged at $800.6, wheat above $350.8 would take the DAP-to-wheat ratio below February 2025’s, and $390.6 would take it to the 2022 peak of 2.05.
6 November. The FAO’s October Food Price Index. Its cereal index, at 122.8, was at its highest since December 2023.
The World Bank’s Commodity Markets Outlook, due in October by its own page, with its price forecasts for grains: those will be the World Bank’s, quoted as such.