DAP is below its 2022 peak. Priced in wheat, it is above it
DAP averaged $800.6 a tonne in September 2026, 16% below its 2022 peak, World Bank data show. A tonne cost 2.31 tonnes of wheat, more than in any month of 2022.
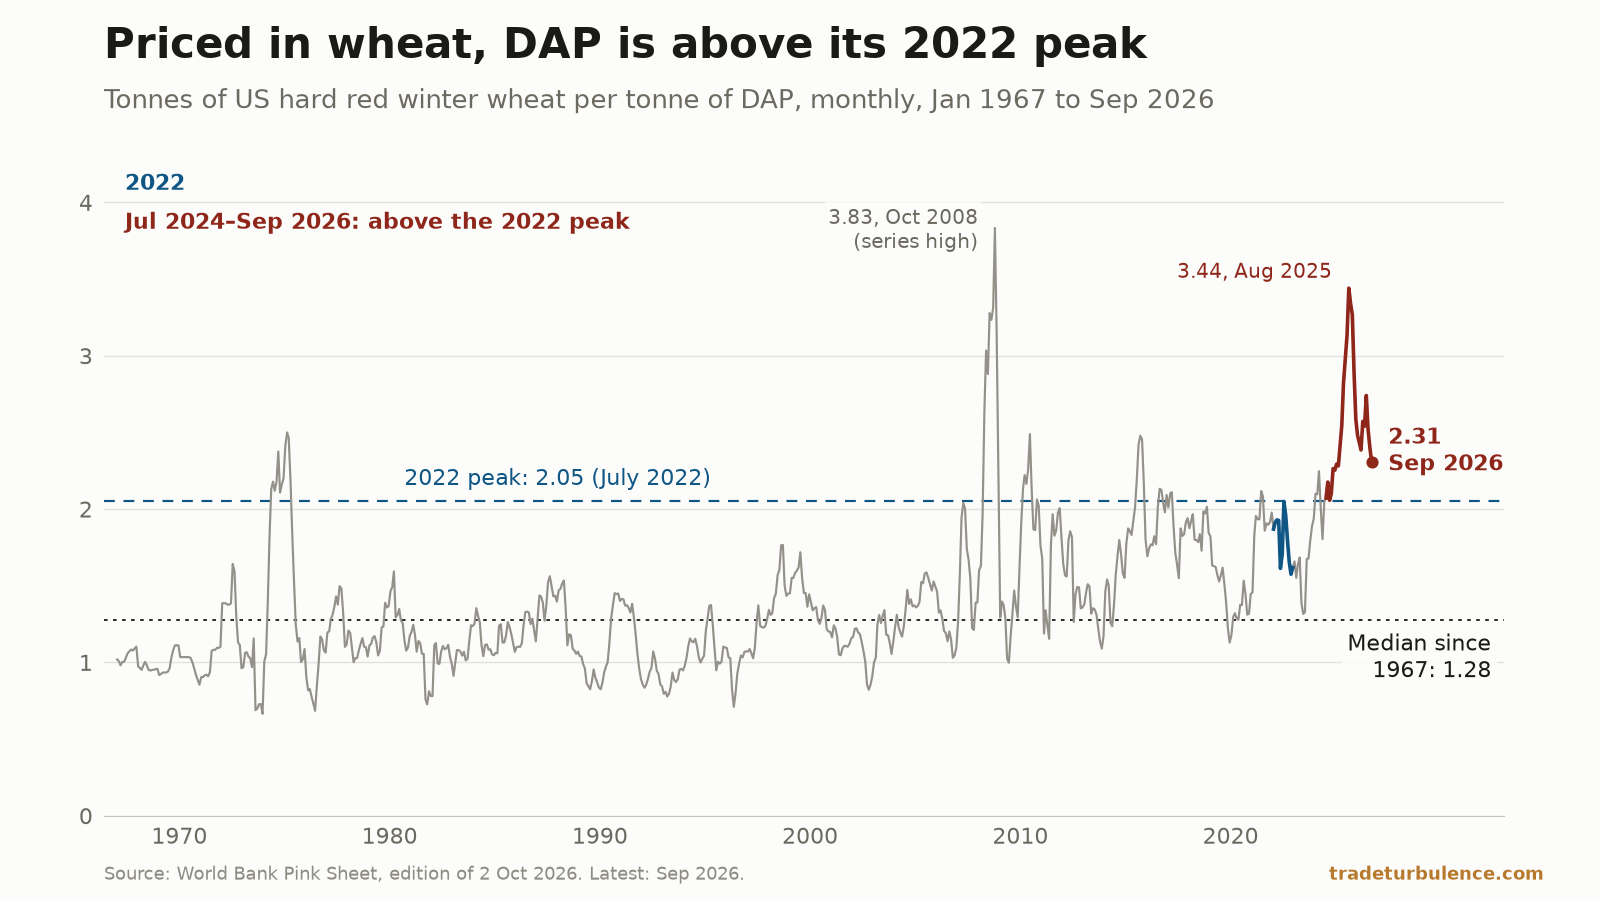
Diammonium phosphate (DAP), a phosphate fertiliser, averaged $800.6 a tonne at the US Gulf in September 2026, in the World Bank’s monthly prices of 2 October. That is its highest since May 2022, and 16.1% below the April 2022 peak. Priced in wheat, the order reverses. A tonne of DAP cost as much as 2.31 tonnes of US hard red winter wheat, more than in any month of 2022, when the ratio peaked at 2.05. It has stayed above that peak for 27 months in a row; in data from 1967, no earlier run lasted more than 12.
A tonne of DAP has cost more wheat than at the 2022 peak since July 2024
Both prices are monthly averages in nominal US dollars a tonne, from the World Bank’s Pink Sheet of commodity prices: DAP free on board at the US Gulf, wheat the US Gulf export price of hard red winter. Dividing the first by the second gives the tonnes of wheat that cost as much as a tonne of DAP, our calculation. Both legs are in dollars, so the ratio needs no adjustment for inflation.
In 2022 the ratio stayed between 1.57 and 2.05, with wheat dear too: when DAP peaked at $954.0 in April, wheat was at $495.3 and the ratio 1.93. In September wheat was 33.6% below its own peak, the May 2022 record in a series from January 1960, even after rising 48.4% on the year to its highest since May 2023. DAP rose 2.6% over the same year.
The ratio has been above 2.05 in every month from July 2024 to September 2026. The nearest it came to that level was 2.057, in September 2024.
Of 34 months since 1967 dearer in wheat than September, 26 came in 2008 or since March 2025
Against the full series, September’s 2.31 is high. Of the 717 months since January 1967, when the World Bank’s DAP series starts, 682 had a lower ratio and 34 a higher one; the median is 1.28. Of the 34, 26 fell in 2008 or since March 2025: eight in April–November 2008, including the record of 3.83 in October, and 18 in a row from March 2025 to August 2026. August 2025’s 3.44 is second only to October 2008. The rest fell in 1974–75, 2010 and 2015.
So the past year’s fall is a fall from near the top. September 2025’s 3.34 was higher than 714 of the 717 months; wheat’s rise has since cut the ratio by 30.9%, to its lowest since February 2025.
The long-run median makes the gap look wider, though not the rank. The ratio has drifted up over the decades: its median was 1.10 from 1967 to 1999 and 1.78 in 2010–19. Against the 2010s, September is 29.7% above the median, and 4 of that decade’s 120 months were higher.
The World Bank’s own commentary uses a DAP-to-food price ratio. In May it put DAP’s April rise down to “tightening supply conditions and rising input costs, particularly sulfur prices, which have doubled since January”, adding that “China’s move to tighten exports has also added upward pressure on prices”. That was its account of April; the monthly prices themselves do not say why the ratio moved.
What this cannot settle
These are export prices at the US Gulf, not what a farmer pays or earns. Freight, subsidies, currencies and local premiums sit between them and any farm, and a price ratio is not a measure of profit.
One fertiliser against one grain. DAP supplies phosphate. Urea and potash move on their own: against wheat, urea was at its lowest since May 2024 in September and potash at its lowest since October 2024.
The wheat series changes grade after June 2020, so the ratio’s history crosses a break in definition.
What to watch
3 November. The World Bank’s next update, with October’s averages. A ratio below February 2025’s level would be the lowest since at least December 2024. With DAP at September’s $800.6, that takes wheat above $350.8, our arithmetic.
2.05. A ratio at or below the 2022 peak would end the 27-month run. With DAP unchanged, wheat would have to average $390.6 or more. The ratio was last at that level or lower in June 2024.