China's share of US imports is back to its 2000 level.
China supplied 7.95% of US goods imports in the year to June 2026, the lowest since June 2000 and down from a 21.8% peak. Mexico is at a record 16.7%.

China supplied 7.95% of US goods imports in the twelve months to June 2026. The last time that figure was as low was June 2000, and the peak in between was 21.8% in February 2016. Mexico is at 16.7%, the highest share in the thirty-six years the two series can be compared, and Vietnam at 6.7%. The Stress Index reads 40.3 — Normal — with its trade-activity component at 12.1.
The share round-tripped in twenty-six years
Every figure here is a twelve-month rolling total. Monthly customs data is not seasonally adjusted and the Chinese new year moves, so a single month can say almost anything; a rolling year cannot be driven by the season at all.
China’s share of everything the United States imports, taken each June:
| June | China | Mexico | Vietnam |
|---|---|---|---|
| 2000 | 7.9% | 11.0% | 0.1% |
| 2010 | 18.5% | 11.9% | 0.8% |
| 2016 | 21.4% | 13.5% | 1.9% |
| 2018 | 21.5% | 13.4% | 1.9% |
| 2022 | 17.6% | 13.5% | 3.8% |
| 2024 | 13.5% | 15.5% | 3.9% |
| 2025 | 11.8% | 15.0% | 4.7% |
| 2026 | 8.0% | 16.7% | 6.7% |
The peak was 21.8% in February 2016. The fall from there took ten years, and more than a quarter of it — 3.8 points of 13.8 — came in the last twelve months alone.
Mexico passed China three years ago and has not gone back
On twelve-month totals Mexico overtook China in July 2023 and has led every month since. On single months the record is shorter and starker: Mexico has shipped the United States more than China in each of the last 17 months, the last exception being January 2025.
June 2026, goods imports in millions of dollars:
| From | June 2026 | 12 months to June |
|---|---|---|
| Mexico | 55,254.6 | $568.5bn |
| Canada | 37,216.8 | — |
| Vietnam | 25,168.4 | $228.8bn |
| China | 25,150.0 | $270.4bn |
Mexico outsold China by $30.1bn in the month, a ratio of 2.20 to one. Mexico is now a larger supplier to the United States than Canada by about half again.
A third of what China lost turns up in Vietnam
Comparing June 2018 with June 2026, China’s share fell 13.6 points. Vietnam’s rose 4.8 and Mexico’s 3.4 — so Vietnam accounts for about 35% of what China gave up and Mexico about 25%.
That matters for how much of this is substitution and how much is relabelling. Taken together the three countries have moved far less than China alone:
| June | China + Vietnam | China + Vietnam + Mexico |
|---|---|---|
| 2018 | 23.4% | 36.8% |
| 2023 | 18.7% | 33.5% |
| 2025 | 16.5% | 31.4% |
| 2026 | 14.7% | 31.4% |
The bloc sat at 31.4% in June 2025 and 31.4% again in June 2026, while China alone fell 3.8 points inside it. In June, Vietnam shipped the United States marginally more than China did — 25,168.4 against 25,150.0 — only the second month that has ever happened, the first being April 2026.
The April peak was the outlier, not the June easing
The monthly ratio of Mexican to Chinese imports ran 2.02 in January, rose to 2.56 in April, then eased to 2.30 and 2.20. Read alone, that looks like China recovering and the substitution stalling.
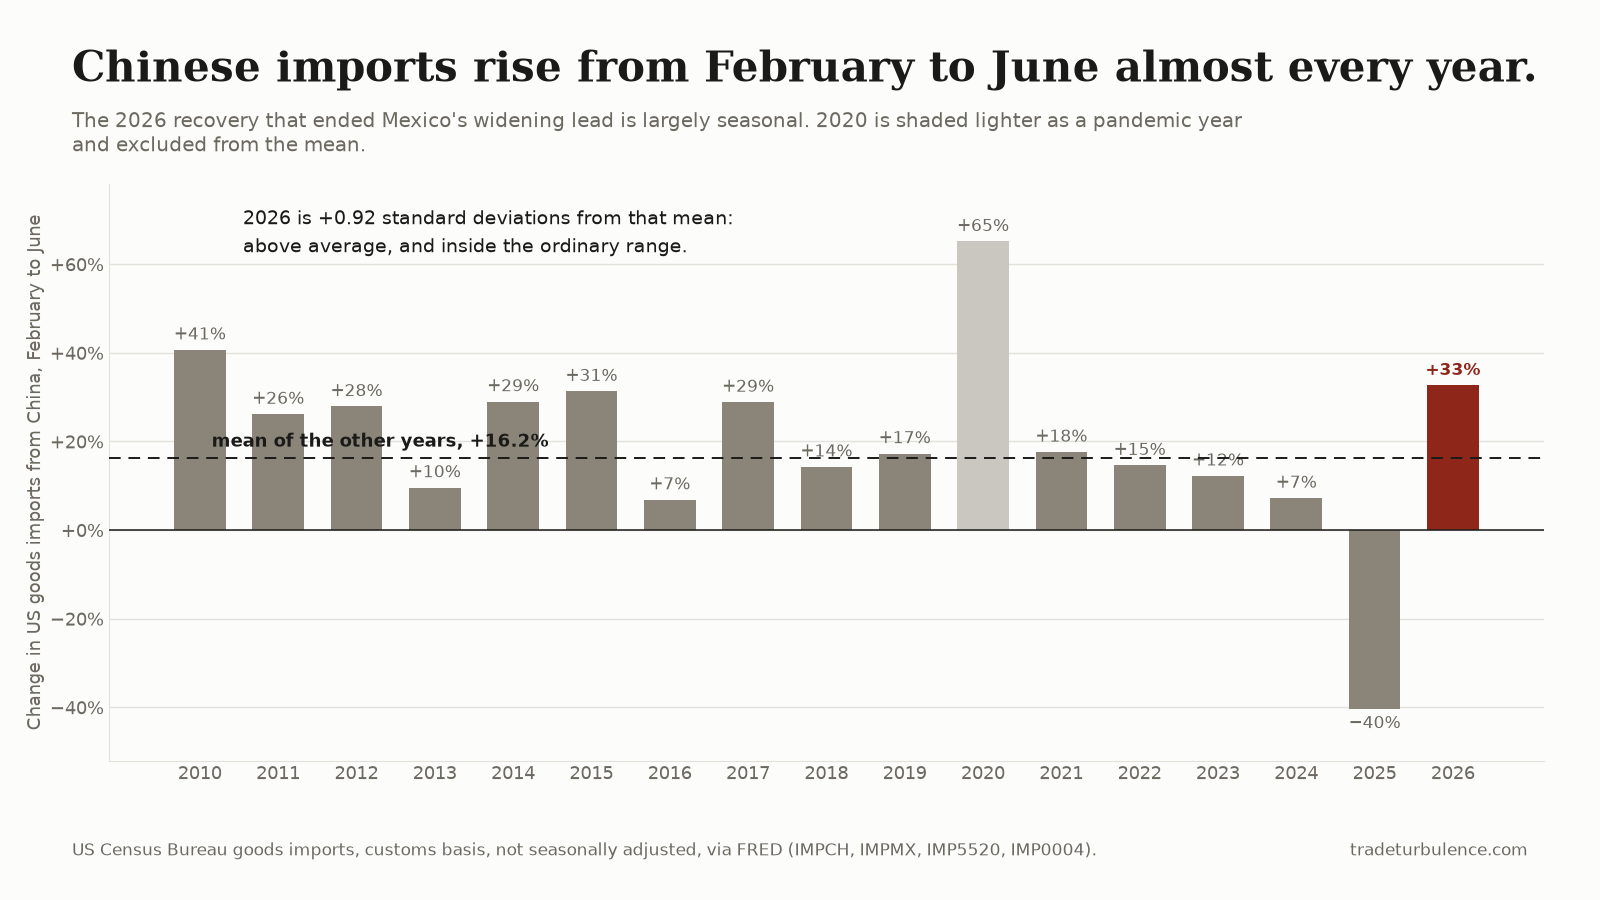
It is mostly the calendar. Chinese imports rose from February to June in 15 of the 16 years since 2010, by a mean of 16.2% with a standard deviation of 17.9. The 2026 rise of 32.7% is 0.92 standard deviations above that mean: higher than usual, and well inside the ordinary range.
The genuine outlier in this series is the other direction. February to June 2025 fell 40.3%, the only negative reading in sixteen years.
The tariff that took effect in July is in none of these numbers
On 24 July 2026 a Section 301 action on forced labour took effect across 60 economies, following determinations published on 2 June. It carries 12.5% on China and 10% on Mexico, and goods from Mexico and Canada entering duty-free under the USMCA are exempt from it entirely.
Every figure above ends in June. The action postdates all of them and explains none of them. What it does is widen the gap on paper by a further 2.5 points at a moment when the measured gap had just stopped widening.
What this cannot settle
Where a good was made. These series record the country a shipment was exported from, not where it was manufactured. Goods of Chinese origin finished or transshipped elsewhere count against the other country. Nothing here can separate real relocation from rerouting, and the Vietnam line is consistent with either.
What moved, as against what it cost. These are nominal dollars. A falling share can reflect lower prices as much as fewer goods.
Why the composition changed. Tariffs, wages, freight and industrial policy all act on these flows at once, and a customs total attributes nothing to any of them.
What to watch
July’s data, due around mid-September. It is the first month that will contain the 24 July tariff, and the first test of whether a 2.5-point differential moves anything.
Whether 31.4% holds. That is the three-country bloc share, flat for two years. If it falls while China keeps falling, the substitution is reaching beyond these three; if it holds, the traffic is circulating inside them.
Whether Vietnam passes China on twelve-month totals. It is $228.8bn against $270.4bn and has closed the gap in every recent month. It has already happened twice on single months.