In 18 days, the Bering Strait beat every earlier October
Ships crossed the Bering Strait 95 times on 1–18 October 2026, more than in any full October in PortWatch's count since 2019. The busiest, in 2025, had 88.
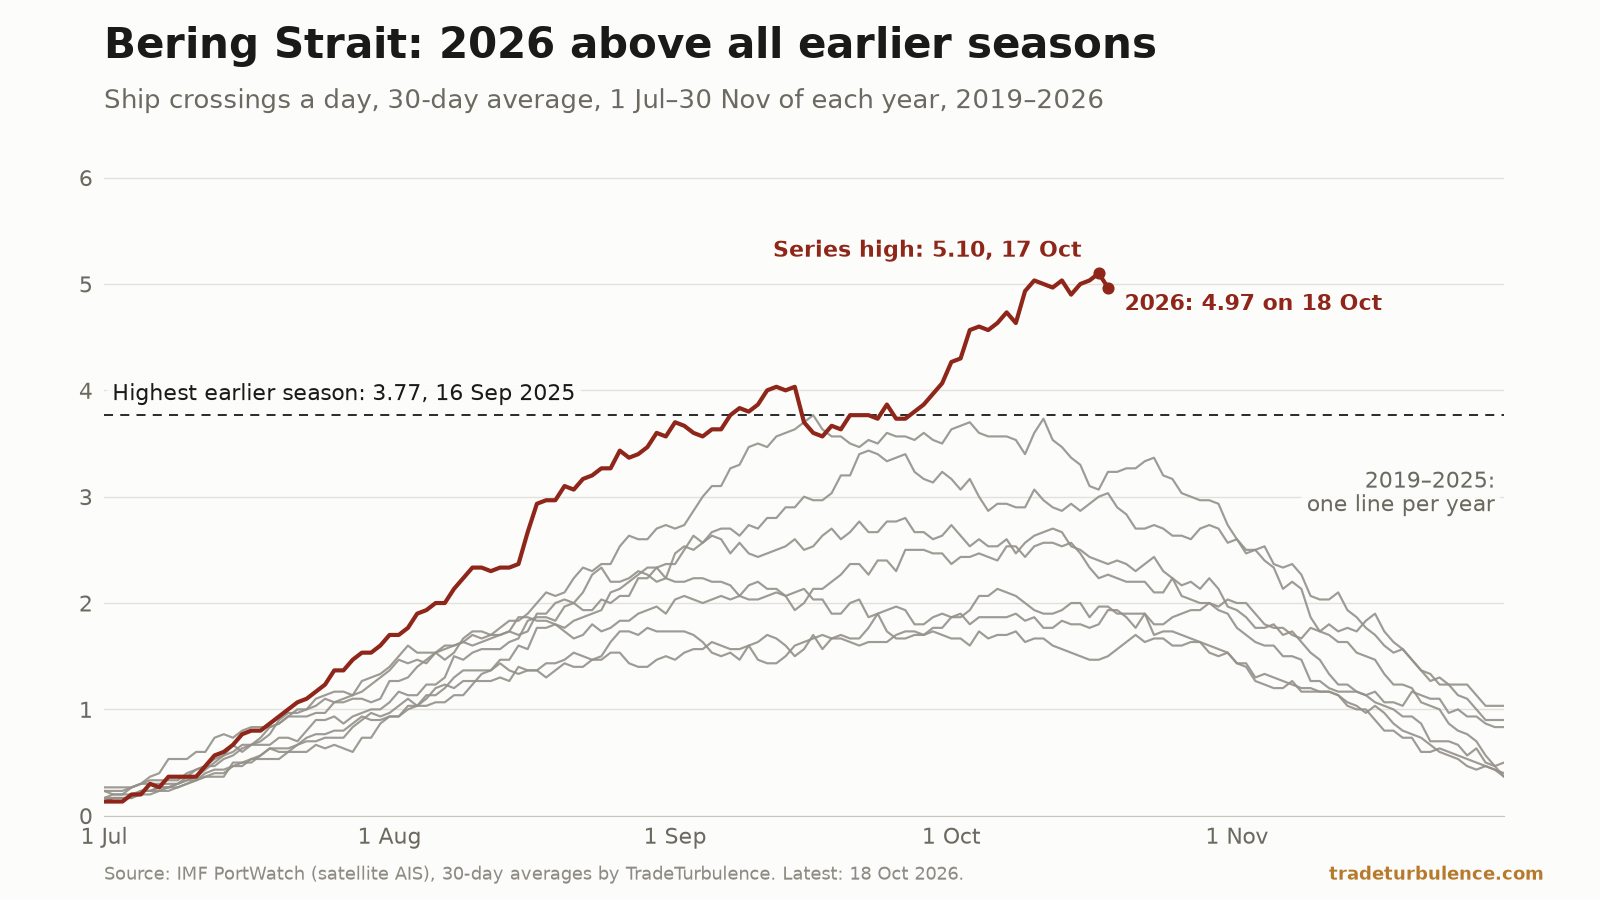
In the first 18 days of October 2026, ships crossed the Bering Strait 95 times, by IMF PortWatch’s count. No earlier October carried as many in all 31 days: the busiest, in 2025, had 88. The same 18 days of 2025 had 59. The strait’s 30-day average reached 5.10 crossings a day on 17 October, the highest in a series that starts in 2019, and the season since 1 July is 29.8% ahead of the same days of 2025. Tankers, bulk carriers and general cargo ships all added to the rise.
Ninety-five crossings in 18 days, against 88 in the busiest earlier October
PortWatch counts the ships crossing maritime chokepoints each day from their satellite AIS signals, in five types: tankers, dry bulk carriers, general cargo ships, container ships and ro-ro ships. Its daily total is exactly the sum of those five on every day of the series, so vessels of other kinds are not in it. The counts are of crossings, not of distinct ships: PortWatch counts a ship again if it crosses more than 48 hours after its last crossing. The Bering Strait’s series starts on 1 January 2019, and its newest day is 18 October 2026, when one ship crossed.
The strait is the Pacific entrance to the Arctic, and its traffic empties and refills every year. So the comparison that counts is the same days in each year:
| Year | 1–18 October | All of October |
|---|---|---|
| 2019 | 26 | 46 |
| 2020 | 31 | 62 |
| 2021 | 39 | 58 |
| 2022 | 33 | 49 |
| 2023 | 42 | 65 |
| 2024 | 55 | 82 |
| 2025 | 59 | 88 |
| 2026 | 95 | — |
On the same days, 2026 had 61.0% more crossings than 2025, the busiest earlier year, and 2.33 times the 2019–2025 average of 40.7. Its running count passed the whole of October 2025 on 16 October.
Against all of October 2025, at 2.84 a day, the 5.28 a day of 1–18 October 2026 would look nearly twice as busy. But the end of the month is usually quieter: in five of the seven earlier years its last 13 days carried fewer crossings a day than its first 18, and over 2019–2025 together they averaged 1.81 a day against 2.26. Day for day, the lead over 2025 is 61%.
The 30-day average set a series high of 5.10 on 17 October
The site reads the counts as a 30-day average, because single days are lumpy. In the 30 days to 17 October the strait had 153 crossings, an average of 5.10 a day, the highest of the 2,819 readings in the series. The eleven highest readings all fall between 7 and 18 October 2026. On 18 October the average was 4.97.
PortWatch publishes in weekly batches and can revise earlier days in each one, so the record was checked on a single vintage. In the site’s earlier data file, which ran to 11 October, 10 October read 5.03; it reads 5.03 in the download made for this piece, and none of the strait’s 30-day readings in the file’s two years changed between the two. The numbers are small. The high is two crossings above 10 October’s reading, and one crossing moves the average by 0.033.
The highest reading before 2026 was 4.67, first reached on 13 February 2020 and held until 24 February, in the middle of winter. It rests on 116 crossings on 26–31 January 2020, after none in the first 25 days of that month, and PortWatch credits every one of them with an estimated cargo of zero. January to March 2019 carried 227 crossings; in 2021–2026 the same months carried between one and nine each year. PortWatch’s data does not say what those winter counts were, and this piece does not rest on them. Inside the season, the highest reading before 2026 was 3.77, on 16 September 2025. This year’s high is 35.4% above it, and the average has been above 3.77 on every day since 27 September.
The site’s 12 October piece found the strait at 4.6 vessels a day on 4 October, adding to the Route Displacement Index as it had in each of the seven earlier years between the same windows. That reading is unchanged on this vintage. The average then rose to 5.03 on 10 October and has moved between 4.90 and 5.10 since, with its high on 17 October.
The season has been ahead of every earlier year since 15 July
July, August and September 2026 each beat the same month of every earlier year. July carried 48 crossings against 41 in 2025, August 110 against 84, September 122 against 105. September 2026, at 4.07 a day, is the busiest of the 93 complete months in the series, ahead of January 2020’s 3.74. At the other end, 15 of those months had no ship at all, all of them between February and May.
From 1 July to 18 October the strait carried 375 crossings, against 289 on the same days of 2025, 29.8% more. On 13 October the season passed the 357 of 2025’s whole July–December season. Its running count has been above every earlier year’s on the same date since 15 July, and its 30-day average above every earlier year’s for the same calendar day since 18 September: 4.97 on 18 October, against 3.23 a year earlier.
The rise did not start in 2026. Each season’s peak has been higher than the last since 2023: 2.80 that year, 3.43 in 2024, 3.77 in 2025. What is new is the size of the step. The 2026 peak, to 17 October, is 1.33 a day above 2025’s, the largest year-on-year rise in the series.
The season also ran later. Every earlier season peaked between 24 August and 11 October; 2026’s highest reading in the data to 18 October came on 17 October, later than any of them. A larger share of the season fell in October: 25.3% of 2026’s crossings from 1 July to 18 October came on 1–18 October, the highest share of any year, against 20.4% in 2025. That is why October’s lead on 2025, 61.0%, is about twice the season’s 29.8%. The October record measures a later season as well as a bigger one.
The site’s Bering Strait page shows the strait’s 30-day traffic on 18 October at +469% against its 2019–2023 baseline, which it rounds to one crossing a day; unrounded, the average of January 2019 to October 2023 is 0.873. That compares an autumn reading with a whole year that includes the empty months, which is why this piece compares season with season instead.
Tankers, bulk carriers and general cargo ships all rose
| Vessel type | 1–18 Oct 2026 | 1–18 Oct 2025 | 2019–2025 average | Change on 2025 |
|---|---|---|---|---|
| Tanker | 42 | 28 | 18.0 | +14 |
| General cargo | 34 | 21 | 16.0 | +13 |
| Dry bulk | 15 | 6 | 4.6 | +9 |
| Container | 4 | 4 | 2.0 | 0 |
| Ro-ro | 0 | 0 | 0.1 | 0 |
| All five types | 95 | 59 | 40.7 | +36 |
Of the 36 extra crossings on 1–18 October, tankers supplied 39%, general cargo ships 36% and dry bulk carriers 25%. Each of those three types carried more than in its own busiest earlier 1–18 October; container ships matched theirs, at four. The rise is not one kind of ship.
Over the season the tankers count for more. From 1 July to 18 October they made up 65% of the 86-crossing rise on 2025, at 181 crossings against 125. Container ships fell, from 27 to 21.
PortWatch also estimates the cargo each ship carried, from its deadweight and how heavily it appears to be loaded. On that estimate, ships crossing on 1–18 October carried 2.11 million tonnes, against 1.27 million a year earlier, 66.7% more. Over the season to date the estimate is 8.11 million tonnes against 5.65 million, 43.4% more, and tankers carried 63% of it.
The Northern Sea Route’s own count also passed 2025’s total
A second count measures something different. The Centre for High North Logistics (CHNL), at Nord University, tracks voyages that complete a transit of the Northern Sea Route in the Russian Arctic. In its overview to 30 September, it counted 104 confirmed transit voyages, “already exceeding the 103 transits recorded during the entire 2025 navigation season”. The figures are preliminary, built “primarily on AIS data from MarineTraffic by Kpler”.
CHNL found that “Tankers formed the largest cargo segment of NSR transit traffic”. It identified 22 eastbound tanker voyages carrying an estimated 2.1 million tonnes, “primarily crude oil”. Around 13 left from Murmansk, five from Primorsk and three from Ust-Luga, all in Russia, and the main destinations were in Asia, among them ports in China. CHNL also wrote that average deadweight per voyage rose from about 60,000 tonnes in 2025 to about 75,000, “indicating that the increase in transit activity was driven not only by a higher number of voyages but also by larger vessels”. Open water along most of the main route “persisted beyond September 30”, it reported.
PortWatch’s count at the strait, for 1 July to 30 September, is 280 crossings against 230 a year earlier, 21.7% more. Both counts rose. They do not measure the same ships: a crossing of the Bering Strait need not be part of a full transit of the route, and CHNL’s count includes “a small number of specialized vessels”, among them research and auxiliary ships, which fall outside PortWatch’s five categories. Neither count confirms the other’s size.
CHNL’s overview does not mention the Gulf, the Red Sea or the Bering Strait.
Traffic slowed on 12–18 October; earlier seasons fell below one a day by 2 December
Most of October’s crossings came in its first 11 days. From 1 to 11 October the strait averaged 6.64 crossings a day; from 12 to 18 October it averaged 3.14, or 22 crossings. The same seven days of 2024 had 26, so 12–18 October was not a high for its dates. The busiest single days of the season, 7 and 9 October, had 11 crossings each; no day of an earlier July–December season carried more than eight.
Earlier seasons fell away at much the same time. In each year from 2019 to 2025 the 30-day average fell below one crossing a day between 15 November and 2 December. On 31 October it stood between 1.53 and 2.73. Along the Northern Sea Route, CHNL wrote that it expected seasonal ice to begin forming “around mid-October”, limiting voyages by ships without ice class, while ships with higher ice classes might sail “into mid-November or even later”.
What this cannot settle
A crossing is not a distinct ship, and not a cargo. PortWatch counts a ship again if it crosses more than 48 hours after its last crossing, so a ship that sails through and back days later is two crossings. It counts vessels from their AIS signals, and a ship with its transponder off is not counted, so every figure here is a floor. The tonnage is PortWatch’s estimate from each ship’s size and draught, not a measured cargo.
The counts carry no reason. PortWatch records when a ship crossed and what type it was, not where it loaded, where it was going or why it chose the route. CHNL describes its rise as more voyages and larger ships; it does not test any link to the Gulf or the Red Sea, and neither does this piece. The counts cannot show whether any of these ships would otherwise have sailed by Suez.
Two counts, two measures. CHNL counts completed voyages along the whole Northern Sea Route; PortWatch counts crossings of one strait. CHNL’s 2026 figures run to 30 September and are preliminary, by its own description.
The record runs from 2019, and the numbers are small. “Series high” means the highest since January 2019. The pre-2026 high came from winter counts PortWatch does not explain, which is why the comparisons here are season against season. The newest day is 18 October, and the next weekly batch can revise the days already published.
What to watch
A new high in the batch for 19–25 October. The 30-day average would pass 5.10 on 19 October if that day alone had 10 crossings, on 22 October with 22 over 19–22 October, on 23 October with 25 over 19–23 October, or on 25 October with 34 over the seven days. The season’s busiest single days had 11, and 12–18 October had 22 in all. With no crossing at all, the average on 25 October would be 4.00, still above every in-season reading before 2026; 21 crossings would keep it above February 2020’s 4.67. If PortWatch keeps its Tuesday pattern, the batch carrying those days lands on 27 October.
127 crossings for October. At that total October would pass September as the busiest month in the series on the average a day, the measure used here for months. It needs 32 more from 19 to 31 October, 2.46 a day; the same 13 days carried between 16 and 31 in 2019–2025. By total alone, 123 would pass September’s 122.
One crossing a day, between 15 November and 2 December. That is when the 30-day average fell below one a day in every earlier year. A date after 2 December would be the latest in the series.
CHNL’s December review. It plans its next publication on Northern Sea Route transits for December 2026, and it expects the Northern Sea Route Directorate to publish official cargo figures after the season ends. CHNL’s scenario that the season “could approach 150 confirmed transits” is its own, and it says the figure “should not be treated as final season results”.