Bab el-Mandeb fell below its 2024 low. Suez did not.
Bab el-Mandeb's 30-day traffic hit 25.5 transits a day on 23 September, the lowest in PortWatch's series from 2019. Tankers were 61% of the fall. Suez held.
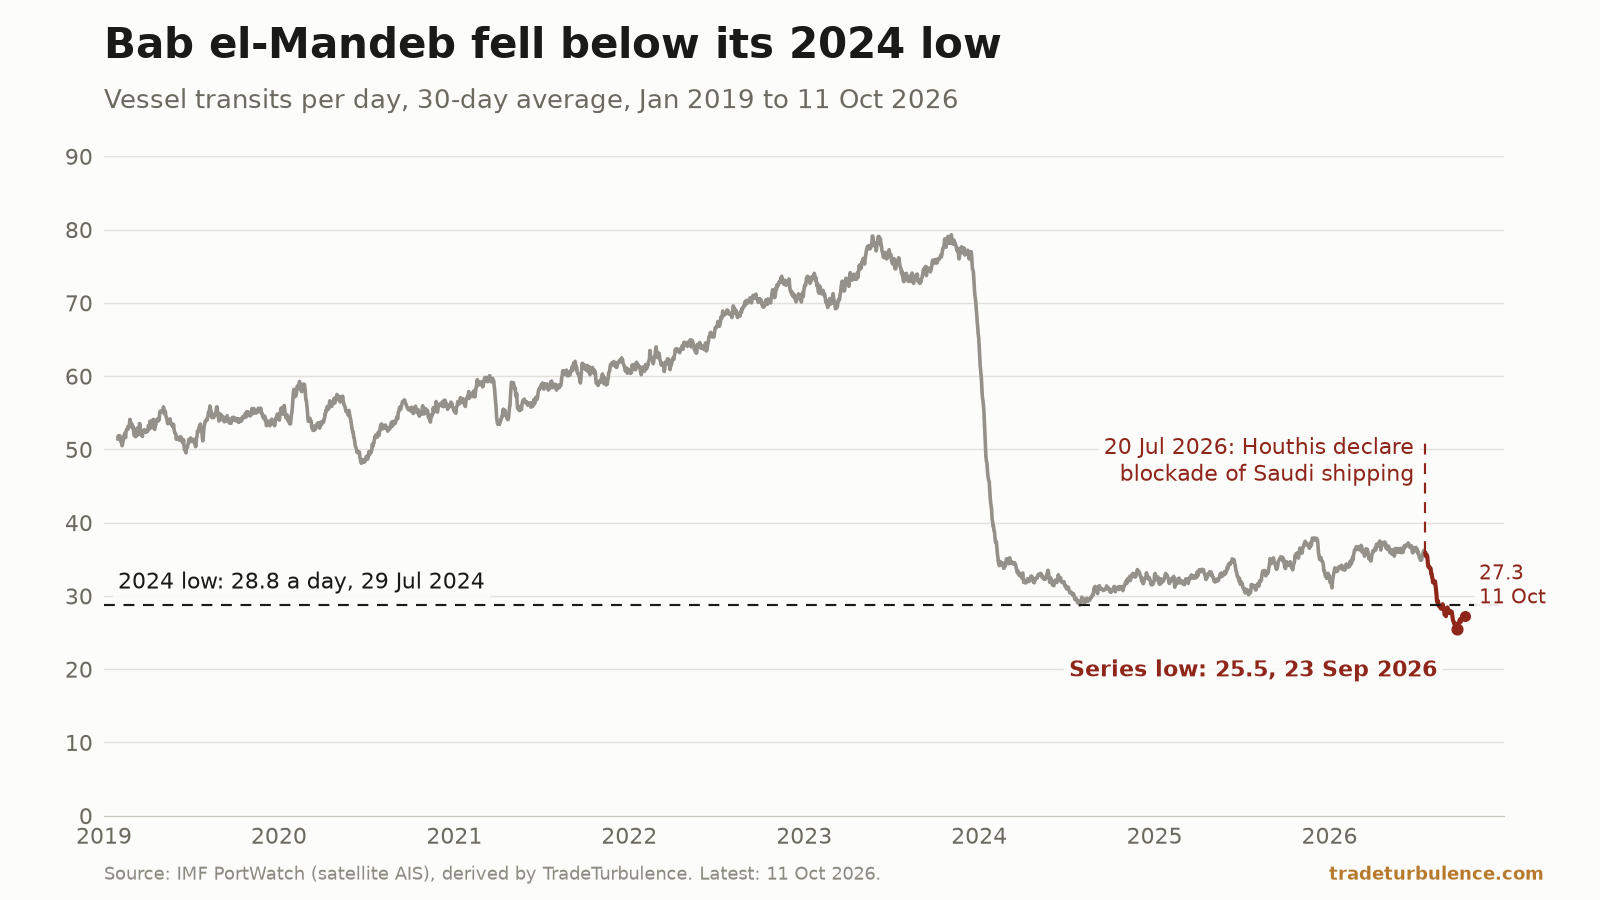
Ships crossing Bab el-Mandeb, the Red Sea’s southern gate, averaged 25.5 a day in the 30 days to 23 September 2026. That is the lowest 30-day figure in IMF PortWatch’s counts, which start in 2019, and 3.3 a day below the low of 2024. The fall began in the fortnight after the Houthis declared a blockade of Saudi Arabia on 20 July, and tankers made up 61% of it. At the Red Sea’s northern end the Suez Canal did not move. The Cape of Good Hope lost ships rather than gaining them.
Bab el-Mandeb has been under its 2024 low every day since 26 August
PortWatch counts the vessels crossing 28 maritime chokepoints each day from satellite AIS positions, and publishes the counts in a weekly batch. Its daily series for Bab el-Mandeb starts on 1 January 2019, and the newest day is 11 October 2026. Single days are lumpy, so the site reads the counts as a 30-day average.
Fetched again in full on 15 October, the series gives 2,812 readings of the 30-day average. The lowest is 25.5 transits a day, for the 30 days from 25 August to 23 September 2026. The ten lowest readings all fall between 18 and 27 September, and no reading before 2026 is as low.
The low of 2024 was 28.8, on 29 July 2024, and it was the lowest reading in the series until 2026. The 2026 average first went under it on 17 August, and has stayed under it on every day since 26 August. The latest reading, for the 30 days to 11 October, is 27.3: 55.4% below the route’s average of 61.2 a day from January 2019 to October 2023.
By month the picture is the same. September 2026, at 26.6 a day, and August, at 27.4, are the two quietest of the 93 complete months in the series. July 2024, at 28.9, is third. From January to June 2026 the route ran between 33.5 and 36.8 a day. The drop from July to August, 6.3 a day or 18.7%, is the largest month-to-month fall since January 2024. It is small beside the 25.8 a day the route lost between December 2023 and January 2024.
The site’s 29 July piece put “whether the Red Sea route stays open” on its watch list. It has stayed open, with 31 vessels crossing on 11 October, but its 30-day traffic of 27.3 is below every reading before 17 August 2026.
Tankers made 61% of the fall, and set a series low of their own
PortWatch splits each day’s count into five vessel types. Between the first half of 2026 and the 30 days to 23 September, Bab el-Mandeb lost 10.4 transits a day, or 29.0%. Most of them were tankers.
| Vessel type | Jan–Jun 2026, a day | 25 Aug–23 Sep 2026, a day | Change | Share of the fall |
|---|---|---|---|---|
| Tanker | 13.74 | 7.37 | −6.37 | 61% |
| Dry bulk | 10.51 | 8.17 | −2.35 | 23% |
| General cargo | 4.64 | 3.43 | −1.21 | 12% |
| Container | 5.75 | 5.00 | −0.75 | 7% |
| Ro-ro | 1.22 | 1.50 | +0.28 | −3% |
| All vessels | 35.86 | 25.47 | −10.40 | 100% |
The tankers’ own 30-day average reached 7.3 a day on 24 September, the lowest in the series; its lowest before July 2026 was 9.97, in September 2025. Dry bulk carriers set a series low too, 8.2 on 23 September, under the 8.4 of February 2025. Container ships did not. Their 30-day low is still the 3.8 of February 2024, and they averaged 5.4 in the 30 days to 11 October.
That is what separates this low from 2024’s. In July 2024, the quietest month before 2026, the route carried 11.3 tankers a day and 5.2 container ships; in September 2026, 8.0 tankers and 5.1 container ships. The container count barely moved between them. The tanker count is where 2026 went lower: September’s 8.0 a day is the lowest month for tankers in the series, against 20.2 a day from January 2019 to October 2023.
The tankers had risen first. In March 2026 the route carried 15.0 tankers a day, its busiest month for tankers from January 2024 on, against 11.5 a day across 2025. The 29 July piece reported that Saudi Arabia had redirected a substantial share of its exports through the East-West pipeline to Yanbu, on the Red Sea, after tanker traffic through Hormuz fell in March. The counts do not say where any tanker loaded. PortWatch’s estimate of the cargo the ships carried, which it builds from each ship’s deadweight and estimated load, reached its lowest 30-day average in the series, 856,098 tonnes a day, on 1 September, against 1.33 million a day in the first half.
The fall began in the fortnight after the 20 July blockade
The Houthis declared a maritime blockade of Saudi Arabia on 20 July, by the accounts of Al Jazeera, reporting with Reuters, and of India TV. India TV reported that the group’s military spokesman, Yahya Saree, said in a video statement that the ban “will be effective immediately”. Both outlets carried the group’s description of the blockade as an “eye for an eye”.
Two days later Saree said, according to Al Jazeera: “We targeted two Saudi oil tankers, named Encelia and Layla, for their violation of the blockade decision”. AFP reported the same claim. The Saudi Press Agency, citing the kingdom’s Transport General Authority, said the Encelia had been hit and all its crew were safe, and called the attacks “a violation of international laws and conventions”, Al Jazeera reported. The UK Maritime Trade Operations centre relayed a tanker master’s report of being “struck by an unknown projectile”, according to the same report.
The counts turn in the same days. In the 14 days to 19 July, Bab el-Mandeb averaged 36.6 transits a day, 13.7 of them tankers. In the 14 days from 20 July it averaged 29.5, with 8.7 tankers. The 30-day average went under the lowest reading of the first half, 31.1, on 11 August.
The same fortnight holds another event, and the data cannot separate the two: American and Saudi forces struck Iran-backed militias in Iraq on 29 July, as the 29 July piece reported. Traffic through the Strait of Hormuz had stepped down earlier, on 9 July: from 23.9 vessels a day in 1–8 July to 6.5 in 9–19 July, and 4.4 in the fortnight from 20 July. A tanker sailing from the Gulf to Suez crosses both straits. The counts date the fall at Bab el-Mandeb. None of the sources opened for this piece measures how much of it the blockade caused.
Suez did not move. The gap between the Red Sea’s two ends reached 15.3 a day
At the Red Sea’s northern end, the Suez Canal carried 40.5 transits a day in the first half of 2026 and 40.7 in the 30 days to 23 September. Its tankers did not change, at 16.3 a day in both, and its container ships rose from 8.6 a day to 10.6. On 11 October, against its own trailing year, Suez’s 30-day traffic was 0.1% lower and Bab el-Mandeb’s 19.5% lower. At 40.9 on 11 October, Suez sits well above its own 2024 low of 34.7. For Egypt, whose canal it is, the count of ships has held through the summer.
From January 2019 to October 2023 the two ends carried almost the same traffic: 61.2 a day at Bab el-Mandeb and 60.3 at Suez. Both fell after that, and a gap opened. Before July 2026, Suez’s 30-day average had never run more than 10.9 a day above Bab el-Mandeb’s, a level reached on 17 August 2024. On 30 June 2026 the gap was 3.8. On 22 September it was 15.3, the widest in the series, and on 11 October it was 13.6. On 23 September Bab el-Mandeb carried 0.63 transits for every one at Suez, the lowest ratio in the series.
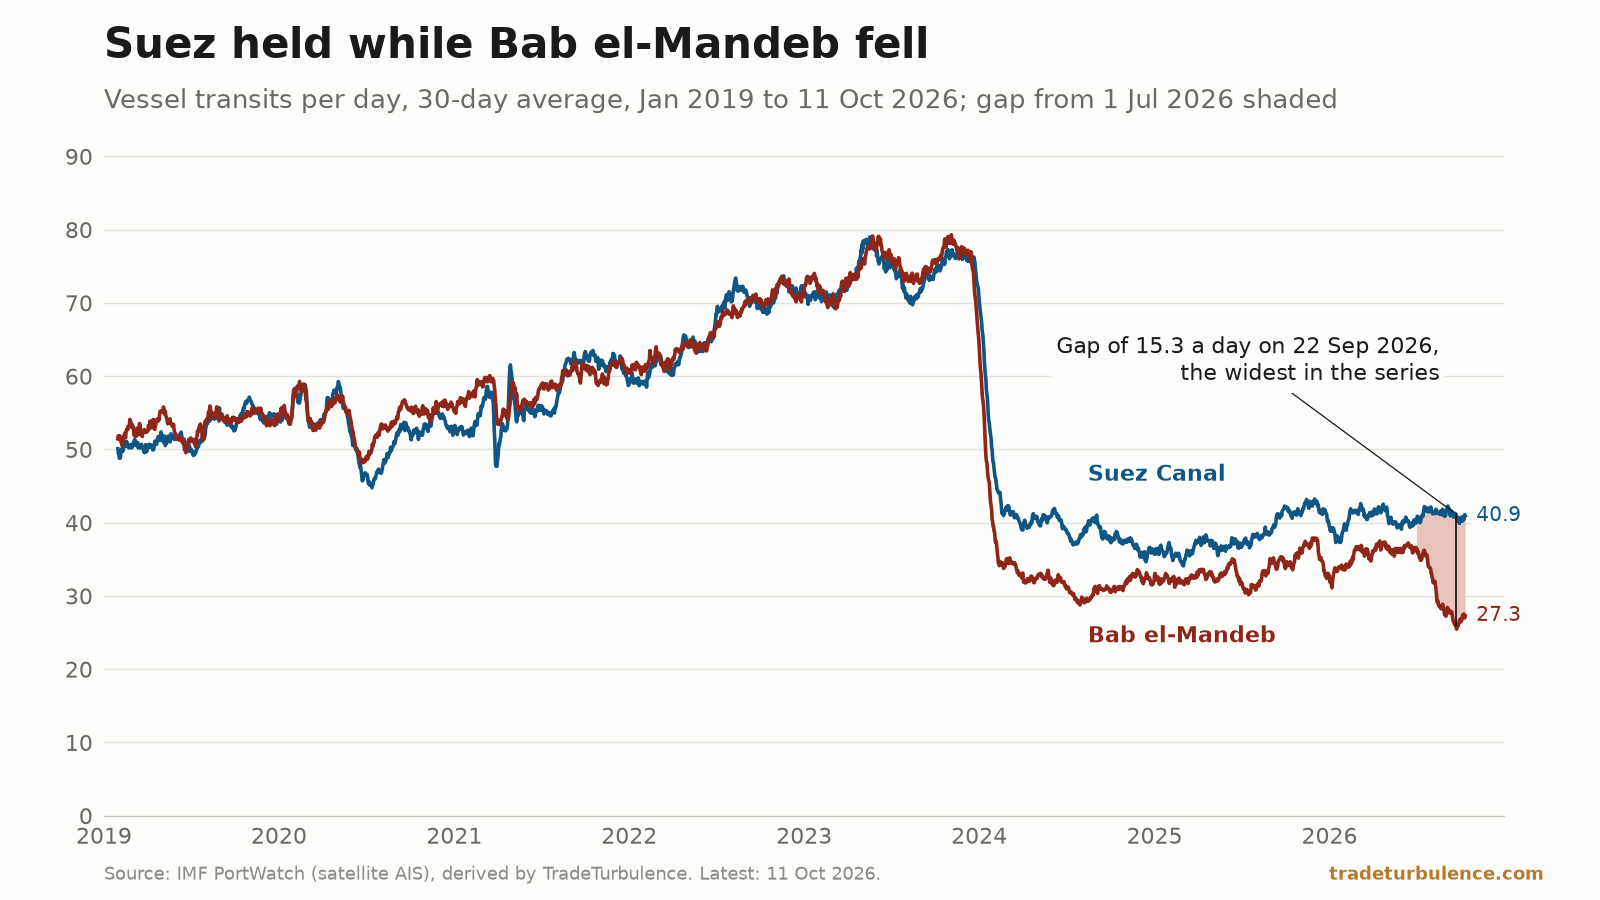
The gap is not a count of ships that turned back inside the Red Sea: PortWatch counts each gate on its own. It shows where the change happened, at the southern end and not the northern one.
The Cape lost ships too. In 2024 it gained them
When Bab el-Mandeb’s traffic fell by 44.7 transits a day between November 2023 and March 2024, in monthly averages, the Cape of Good Hope gained 36.7. The site measured that shift in August, route by route. This time the Cape fell with it. Between June and September 2026 Bab el-Mandeb lost 10.1 transits a day and the Cape lost 6.7.
Between the first half of 2026 and the 30 days to 23 September, the Cape went from 91.5 transits a day to 86.6. Its container ships fell from 20.4 a day to 16.4, and its tankers from 18.7 to 17.3. On 11 October its 30-day traffic was 3.9% below its own trailing year. Where Bab el-Mandeb’s missing tankers went, to another route, to a port inside the Red Sea or to no voyage at all, transit counts cannot show.
The site’s Stress Index read 81.5 on 14 October, in its Severe band and higher than every day of its 2010–2019 reference period (version 3), with its shipping-routes pillar at 95.8. The 12 October piece found Bab el-Mandeb supplied 0.133 points of the Route Displacement Index’s 1.451-point rise between 8 August and 4 October.
What this cannot settle
A transit is a ship, not a cargo. PortWatch counts vessels from their AIS signals, and a ship with its transponder off is not counted, so each count is a floor. The tonnage figure is PortWatch’s estimate of what the ships carried, worked out from their size and draught, not a measured cargo. Nothing here measures barrels.
Each strait is counted on its own. The counts do not follow voyages. They cannot say which ships crossed both Suez and Bab el-Mandeb, where the missing tankers went, or how much of Bab el-Mandeb’s fall is the same ships that stopped crossing Hormuz.
The timing is not a cause. The fall starts in the fortnight after the 20 July declaration, but that fortnight also holds the 29 July strikes. The data dates the change; it does not explain it.
The record runs from 2019, and the newest day is 11 October. “Lowest” means lowest since PortWatch’s series begins in January 2019. PortWatch publishes in weekly batches and revises past days between them, as the 12 October piece found.
What to watch
31.0 a day from 12 to 18 October. That is what the week after 11 October must average for the 30-day figure to be back at 2024’s low of 28.8 on 18 October. The last seven published days, 5–11 October, averaged 28.3. Because the days leaving the window, 12–18 September, averaged 24.7, the bar falls fast: 28.7 a day over 12–25 October would do it by 25 October.
October against July 2024. October’s first 11 days averaged 28.7. October finishes above July 2024, and out of the series’ three quietest months, only if 12–31 October carries at least 581 transits, 29.05 a day; 580 would leave the two months tied.
Tankers back above 9.97 a day. The tankers’ 30-day average has risen from its low of 7.3 on 24 September to 8.3 on 11 October, still 1.7 below 9.97, its lowest before July 2026. Above that level, tanker traffic would be back inside its range before July.
The gap with Suez back under 10.9. It was 13.6 transits a day on 11 October. Under 10.9, the widest it had been before July 2026, the Red Sea’s two ends would be back inside the range of every earlier day in the series. PortWatch’s next weekly batch should carry the days to 18 October.