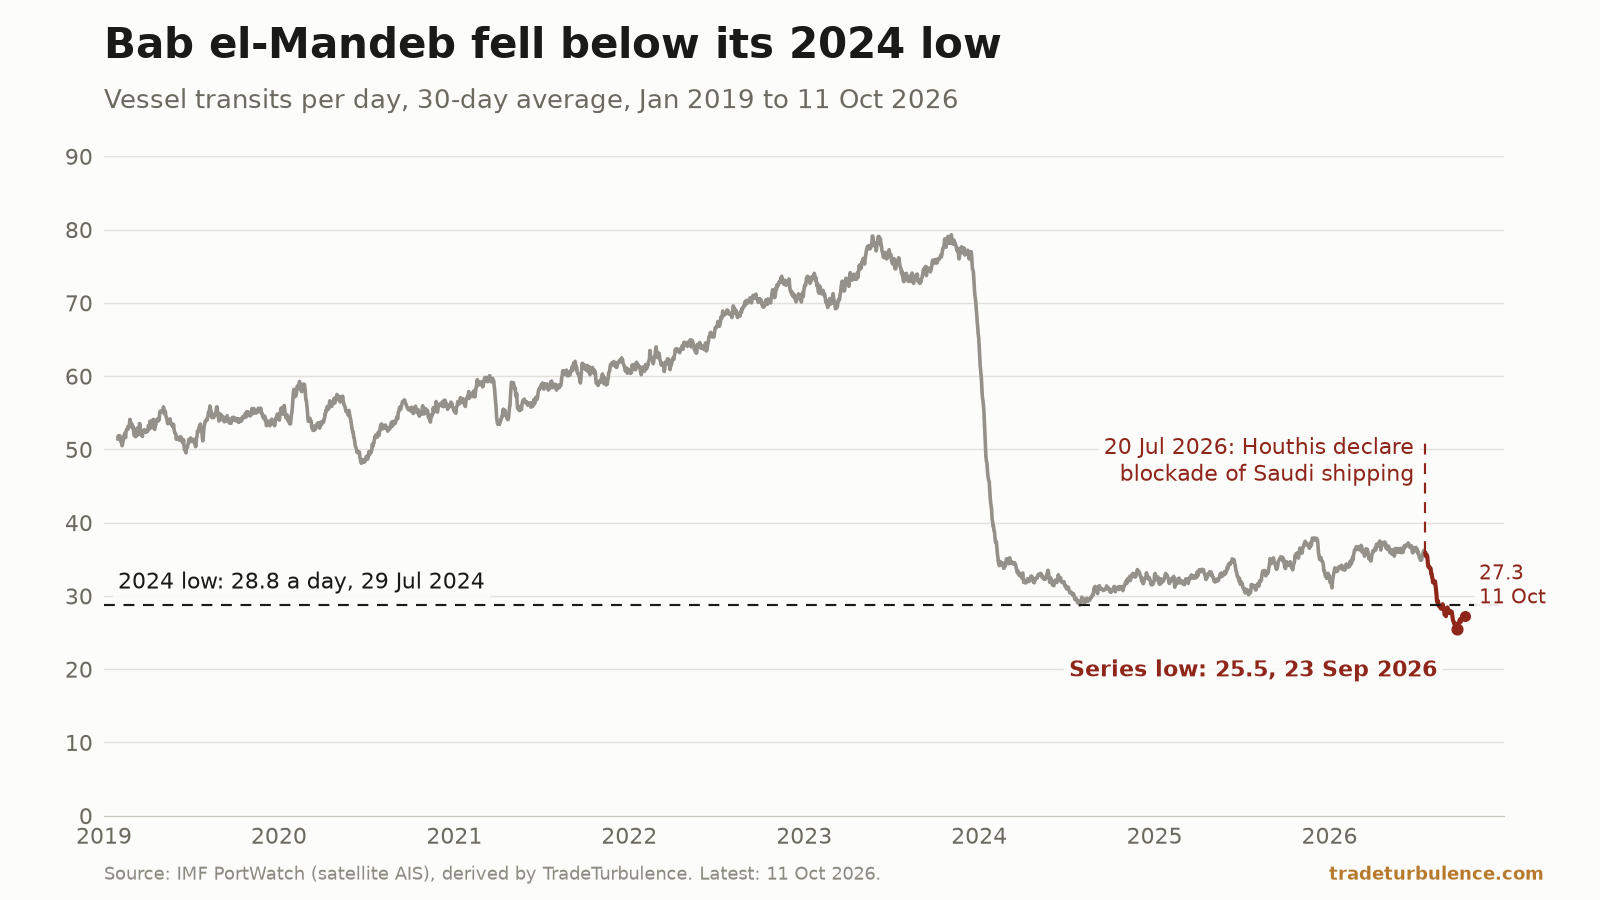
Bab el-Mandeb's 30-day traffic hit 25.5 transits a day on 23 September, the lowest in PortWatch's series from 2019. Tankers were 61% of the fall. Suez held.
Geopolitics & trade
Conflict, chokepoints and export policy, read through the trade flows they disturb rather than the statements that accompany them.
20 pieces
Mar 2026 – Oct 2026
Every figure traces to a named public source.
- The Bosporus is 34% of the rise in route displacement. Hormuz, 3%
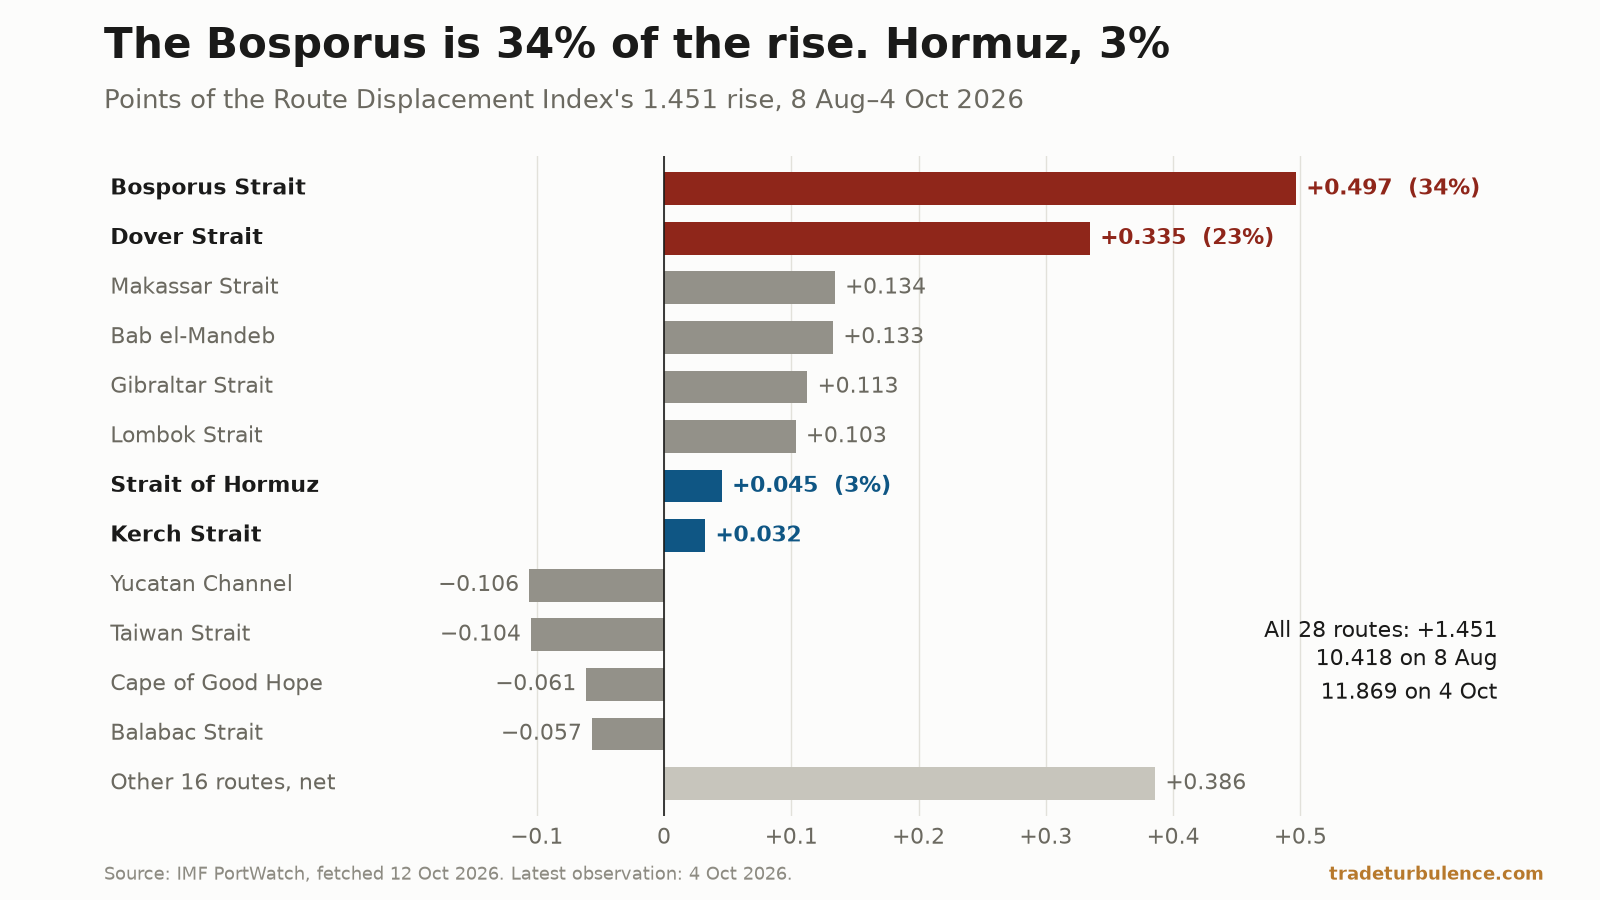
On counts fetched 12 October, the Route Displacement Index rose from 10.42% on 8 August to 11.87% on 4 October. The Bosporus and Dover supplied 57%; Hormuz, 3%.
- The Rhine at Kaub has spent 41 days below its 2018 record
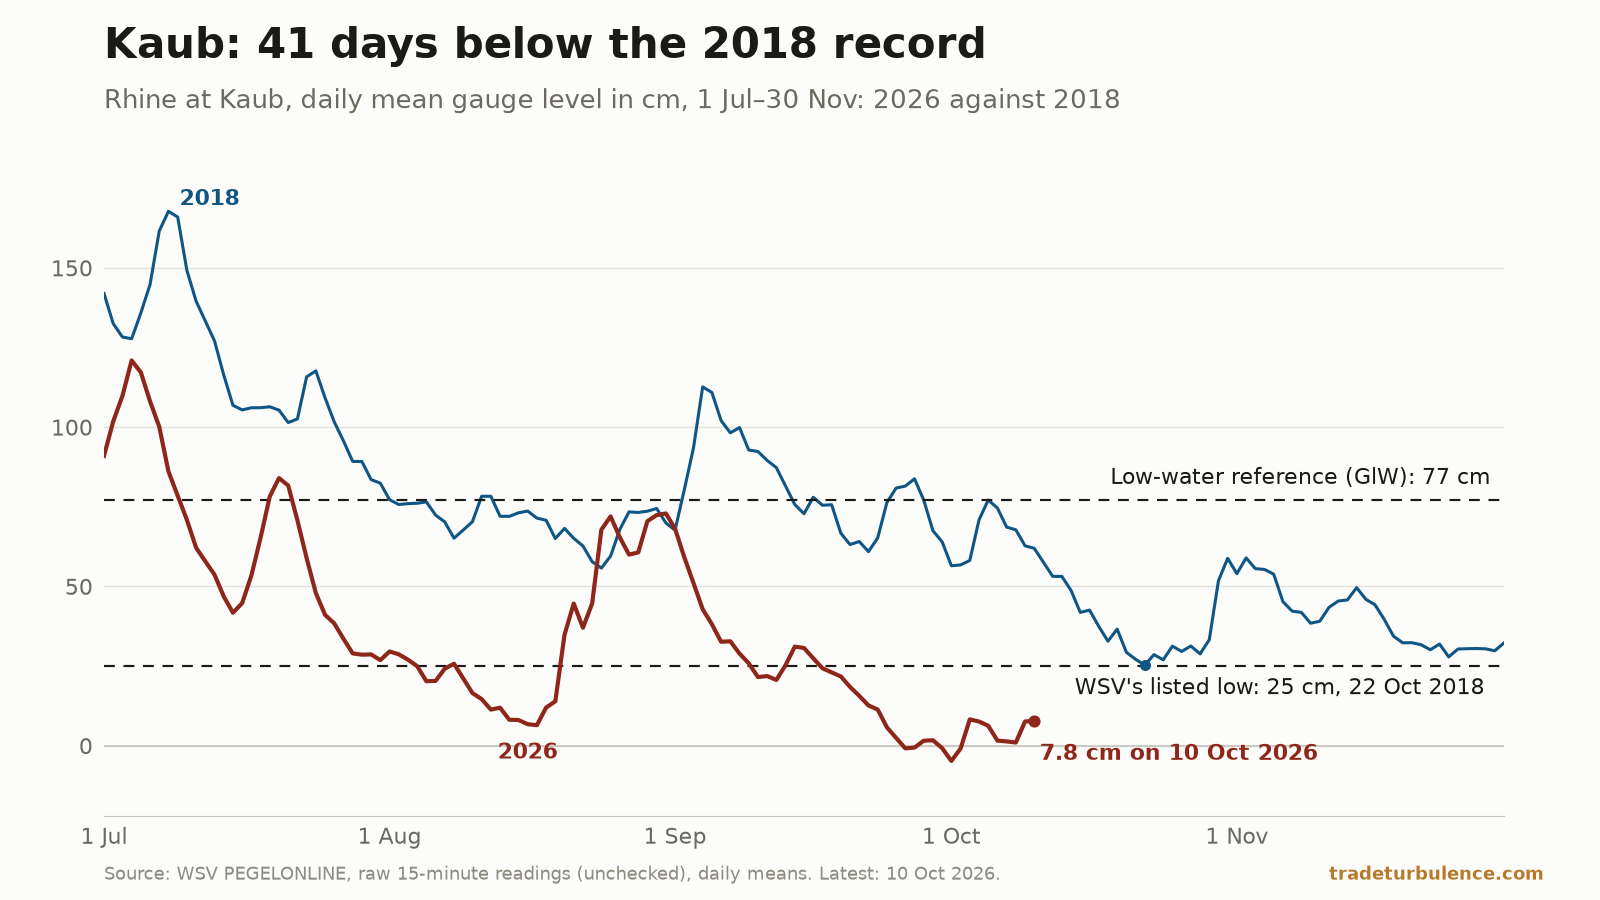
The Kaub gauge averaged 7.8 cm on 10 October, its 41st day of 2026 below the 25 cm low of 2018. From 2000 to 2025, no day in the agency's data was under it.
- Kerch now moves in a month what it once moved in a day
In the 30 days after Russia's 10 July suspension notice took effect, 34 vessels passed the Kerch Strait. Its 2019–23 baseline moved 37.4 in an average day.
- China's share of US imports is back to its 2000 level.
China supplied 7.95% of US goods imports in the year to June 2026, the lowest since June 2000 and down from a 21.8% peak. Mexico is at a record 16.7%.
- A tenth of chokepoint traffic is on a different route.
The Route Displacement Index reached 10.29% on 8 August, the highest of 2,749 daily readings since 2019. Total chokepoint transits ran 6.1% under baseline.
- Malacca peaked in January. The Red Sea never moved it.
Malacca's busiest month on record was January 2026. It sits 23% above a baseline that contains the pandemic, and 3.5% below its own trailing 12 months.
- The Kerch Strait broke 107 days before the invasion
Kerch Strait transits fell to 3.1 a day in July 2026, in what is normally its busiest season. The daily series broke on 9 November 2021, not in February 2022.
- The Strait of Hormuz hit zero three times. It is still at 18%.
Transits through the Strait of Hormuz fell from 152 on 22 February to zero on 13 March. July ran at 16.5 a day against an 89.7 baseline — 18% of normal.
- The China discount reversed in dollars. In yuan it never did.
The pre-duty price of Chinese goods has risen 2.1% in dollars since July 2025. Translated back into yuan, the same series fell 3.6% over the same months.
- Saudi Arabia entered the war. The index cannot see it yet.
US and Saudi forces struck Iran-backed militias in Iraq on 29 July. Every series in the Stress Index predates it — the oldest by 89 days. What that hides.
- US imports didn't fall under tariffs. They changed address.
China's share of US goods imports fell from 17.4% to 7.8% since 2022. Total imports rose 4.8% over the same period. Mexico took only 39% of the difference.
- Ukraine hit Iran-bound ships in the Caspian. Oil is up 22%.
Ukraine's Caspian strikes fused two wars into one supply line. Brent has round-tripped from $71 to $138 to $68, and the price data stops before the attack.
- The US trade deficit widened $23bn in a month. The level isn't the story.
May's $23bn one-month widening was the third largest since 1992 and is not seasonal. But the deficit is trending better, not worse — and monthly swings this size …
- Navigating the Ripple Effects: Global Trade and Market Forecasts in the Wake of Iran's Attack on US Oil Tanker
Explore the geopolitical and economic aftermath of Iran's attack on a US oil tanker, examining trade disruptions and market impacts.
- Iran's Oil Strategy: Navigating the Strait of Hormuz Amid Conflict and Global Market Shifts
Explore how Iran continues to export millions of barrels of oil to China via the Strait of Hormuz despite regional conflict. Analyze the geopolitical, economic, and …
- China's Export Surge Amid Middle East Conflict: A Geopolitical Trade Analysis and Its Impact on the USA and EU
Explore how China's strategic export increase before the Middle East conflict reshapes global trade dynamics, affecting imports in the USA and EU. Analyze the …
- Oil Market Turmoil: How Gulf Giants' Output Cuts and the Iran Conflict Are Reshaping Global Energy
Explore the unprecedented upheaval in the oil market as Gulf output cuts and the Iran conflict push prices to historic highs. Discover the geopolitical and economic …
- Geopolitical Tensions Could Skyrocket Oil Prices to $150-$200 Per Barrel: What Investors Need to Know
Explore how escalating Middle Eastern conflicts could drive oil prices to unprecedented highs. Understand the potential impacts on global markets and investor …
- Global Economic Shockwaves: The Impact of Iran's Strait of Hormuz Shutdown
Discover how the closure of the Strait of Hormuz is sending shockwaves through global oil markets and threatening economic stability worldwide. Explore expert …


Other sections
About this section
Geopolitical forces increasingly dictate the contours of global commerce. Trade policy analysis has evolved from tracking tariff schedules to understanding how sanctions, export controls, and cross-border trade dynamics reshape supply chains and capital flows. This section examines the intersection of geopolitics and trade, where decisions in Washington, Brussels, and Beijing ripple through ports, factories, and financial markets worldwide.
Tariffs remain a primary lever of economic statecraft, but their impact extends far beyond headline rates. We analyze how retaliatory measures, preferential agreements, and regional trade blocs create winners and losers across industries. Sanctions regimes—whether targeting nations, sectors, or individuals—introduce compliance complexity and force rapid reconfiguration of trade routes. Geopolitical risk assessment now demands scrutiny of shipping lanes, energy corridors, and critical infrastructure that underpin cross-border trade dynamics.
Supply chain disruptions born from conflict, natural disaster, or policy shifts have exposed the fragility of just-in-time global production. Defense implications of trade dependencies, particularly in semiconductors and critical minerals, have elevated supply chain security to a strategic priority. Our analysis draws on authoritative data sources including FRED for macroeconomic context, WTO trade flow statistics, and specialized trade flow databases to ground qualitative assessment in quantitative reality. Understanding these forces is essential for anyone navigating the turbulence at the intersection of geopolitics and trade.