A Stress Index of 80 is higher than any day of 2010–2019
Severe starts at 80. No weekday of 2010–2019 reached it. As built at 02:16 UTC on 13 October 2026, 68 weekdays of 2026 had; version 3 read 82.3 for 9 October.
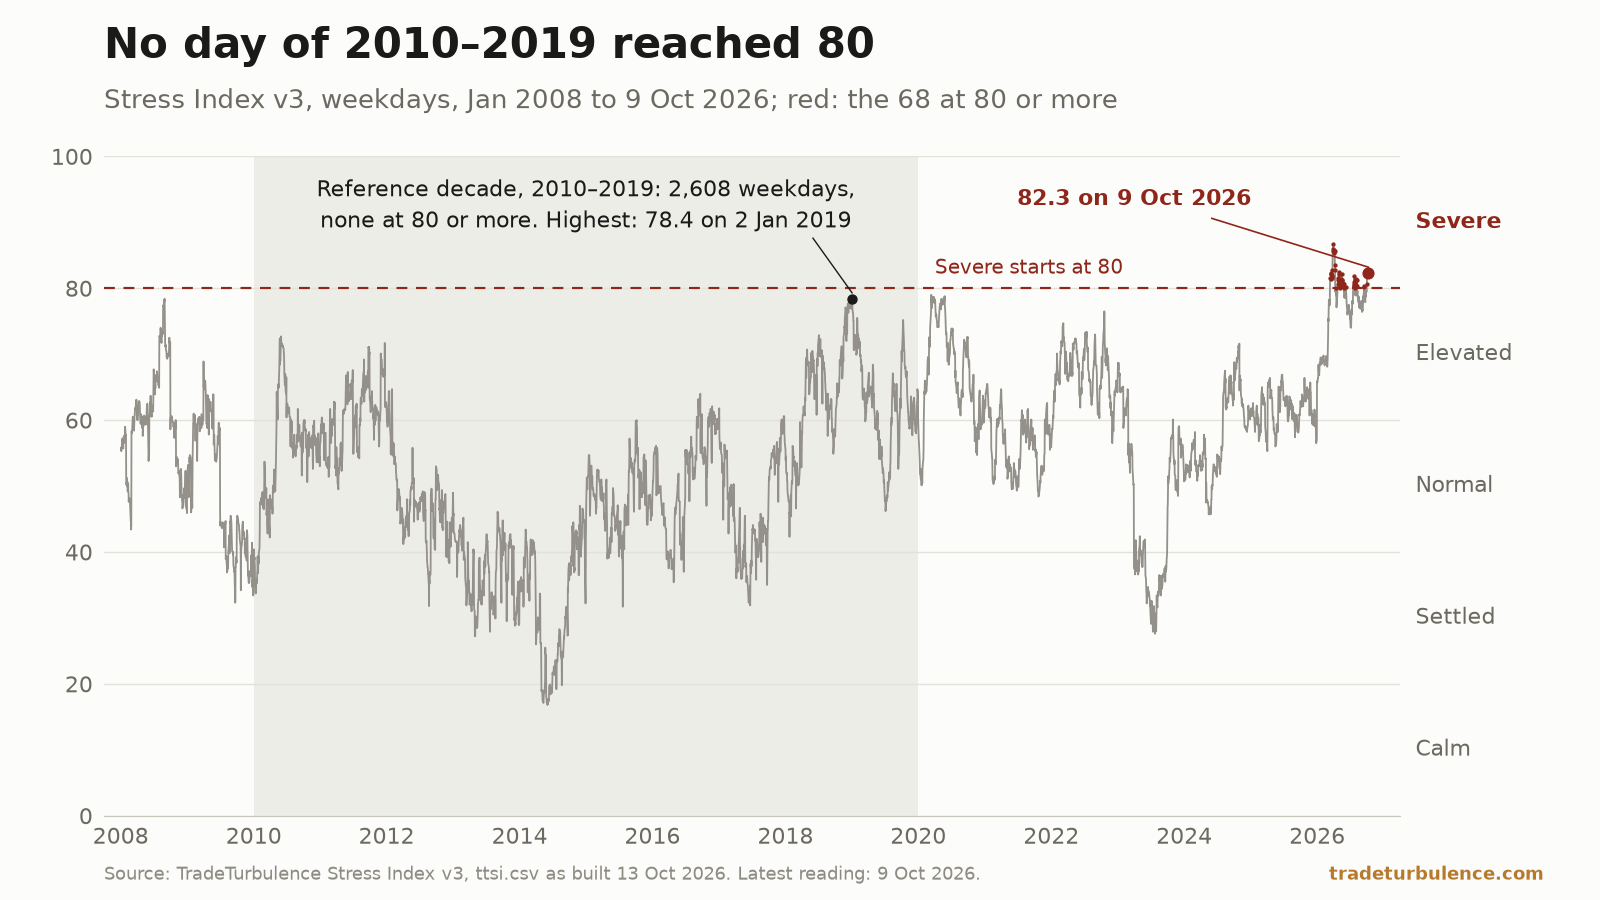
The Stress Index scores from 0 to 100 how hard it is to move goods across borders and pay for them, against fixed reference years: 2010–2019 for all but its two shipping inputs. The middle day of 2010–2019 read 50.6. The top band, Severe, starts at 80: none of that decade’s 2,608 weekdays reached it, and 68 had by 9 October 2026, all in 2026. Version 3, as built on 13 October 2026, read 82.3, Severe, for that day, with one of five pillars at 38.4. Its specification says it measures friction, not the volume traded, and a reading printed before October 2026 is on a different scale.
No weekday of 2010–2019 reached 80, and 68 since have, all in 2026
The index is published as a file with one row for every weekday from 2 January 2008. As built at 02:16 UTC on 13 October 2026 it has 4,898 rows, the last for 9 October 2026. Unless another source is named, every figure from the index in this piece is from that build, and every count of days in a band or at a level is a count of those rows. Each row gives the reading, its band and the five pillar scores. A “day” here is one row, and a day is in a band when the file’s band column says so.
The bands are 20 points wide. The 2,608 weekdays from 1 January 2010 to 31 December 2019, the index’s reference decade, divide like this: 41 in Calm, below 20; 466 in Settled, from 20; 1,493 in Normal, from 40; 608 in Elevated, from 60; none in Severe, from 80. More than half the decade was Normal, and an Elevated day came a little less often than one day in four. The methodology page puts it in a sentence: “50 is an ordinary day of the 2010s.” The median day read 50.6.
The decade’s highest day was 78.4, on 2 January 2019, and 34 days, all of them in 2018 and 2019, were at 75 or more.
The file begins two years before that decade and runs on after it. None of its 3,130 weekdays up to 31 December 2019 is in Severe. Of the 1,768 from 1 January 2020 to 9 October 2026, 68 are, one in 26, and all 68 are in 2026. The first was 13 March 2026, at 81.5. Before 2026 the highest day in the file is 79.0, on 12 March 2020, inside the window the index marks as the Covid-19 shutdown. The record is 86.7, on 31 March 2026. Elevated accounts for 969 of the 1,768 weekdays from 1 January 2020, 55% against 23% in the reference decade, and Calm for none.
In that build the reading for 9 October 2026 is 82.3, 2.3 points above the floor and above every one of the decade’s 2,608 days. In the whole file 19 days are at or above 82.3, all in 2026.
A score is a rank against fixed years, and 100 means beyond them
Each of the index’s ten inputs is turned into a rank: the share of that input’s own values in the reference period that were lower. By the methodology page’s example, a score of 90 means “higher than on 90% of reference days”. A value above every one of them scores 100, and the index page flags it.
In the reading for 9 October 2026, three of the ten inputs were above everything in their reference period. The US effective tariff rate was 7.82% of import value over the 91 days to 8 October, against a 2010–2019 high of 4.95%. The 20-day realised volatility of Brent was 88.1% at an annual rate on 6 October, against a high of 72.0%. The Route Displacement Index, the share of traffic at 28 maritime chokepoints that is on a different route than in 2019–2023, was 11.9% over the 30 days to 4 October, against a high of 6.2% in its reference window.
The same barrel of oil shows what a rank does. Brent’s volatility scored 100. Its price, $125.44 on 6 October, scored 59.3 against the decade’s prices in August 2026 dollars, the newest month of US consumer prices in the build: a median of $104.1 and a high of $188.8.
The reference years do not move. They are 1 January 2010 to 31 December 2019 for eight of the inputs, and 1 January 2019 to 31 October 2023 for the two shipping inputs, because the IMF PortWatch data they are built from begins in 2019. Version 2 of the index ranked each input against a rolling five years, and the methodology page records what that did: “A disruption that persists becomes part of its own window, and its readings drift back toward 50 while nothing has been fixed.”
Five pillars, weighted 25, 20, 20, 20 and 15, make the one number
The ten inputs sit in five pillars. Shipping routes, a quarter of the index, is the Route Displacement Index and a shortfall: the share of usual volume missing at chokepoints running below their 2019–October 2023 average. The volume is the IMF’s, which defines it as the “total trade volume (in metric tons) of all ships transiting through the chokepoint at this date”. Supply chains, a fifth, is a single series, the New York Fed’s Global Supply Chain Pressure Index. Energy costs, a fifth, is Brent’s volatility and its inflation-adjusted price. Money and finance, a fifth, is the 63-day change in the broad dollar, the St. Louis Fed’s Financial Stress Index and the VIX. Trade policy, 15%, is the tariff rate, which divides the customs duties in the Daily Treasury Statement by the value of goods imported, and an index of trade policy uncertainty drawn from US newspapers.
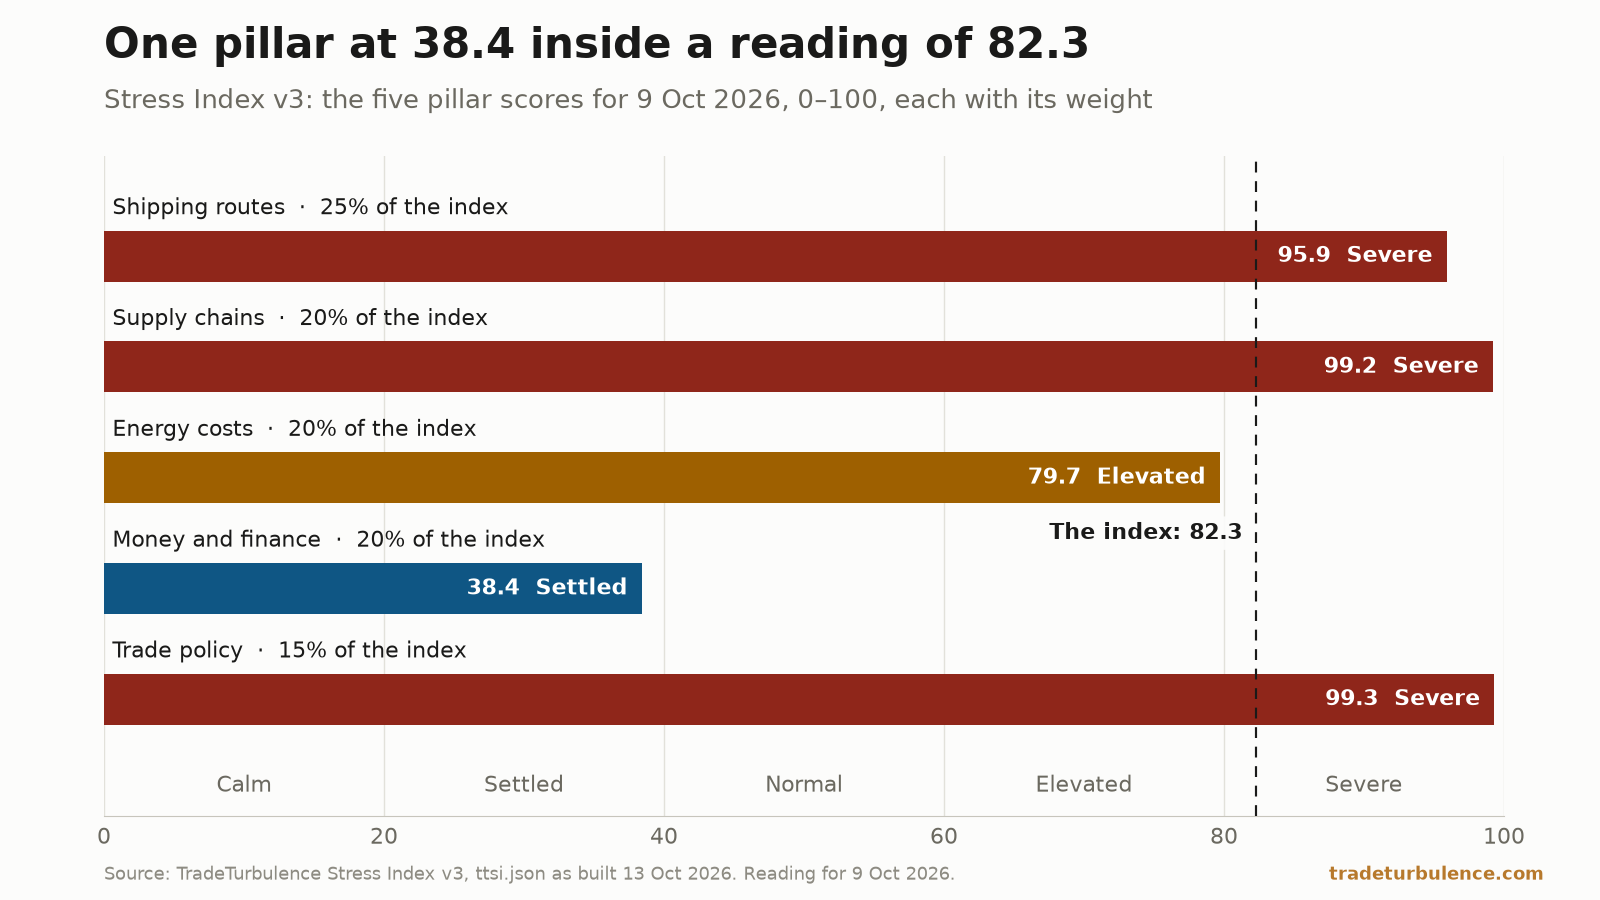
A pillar’s score is the weighted average of its inputs’ ranks, and the index is the weighted average of the five pillars. In the 13 October build the pillars for 9 October 2026 read 95.9, 99.2, 79.7, 38.4 and 99.3, in that order. Times their weights, that is 24.0, 19.8, 15.9, 7.7 and 14.9 points, which sum to 82.3.
Before 30 January 2019 there is no shipping pillar. The index for those days is the other four re-weighted, and the file leaves the routes column empty. That is 2,368 of the reference decade’s 2,608 days, the highest of them included.
Money and finance was the lowest pillar on all 68 Severe days
An average hides its parts in both directions. In the reading for 9 October 2026 money and finance was 38.4, in Settled: the broad dollar had risen 0.46% over the 63 daily readings to 2 October, the St. Louis Fed’s index was −0.47 on the same date and the VIX was 14.8 on 9 October. The pillar supplied 7.7 of the 82.3 points.
Money and finance was the lowest of the five on all 68 Severe days, between 27.7 and 66.8, and below 40 on 33 of them. On every weekday of 2026 in the file, shipping routes, supply chains and trade policy were each at 80 or more; money and finance was on none.
A low pillar can still move the headline. The index went from 79.6 on 30 September 2026 to 80.7 on 1 October, out of Elevated and into Severe. Three pillars were unchanged to one decimal that day and energy costs fell by 0.4. Money and finance rose from 27.9 to 33.8, still in Settled, and at a fifth of the index that was worth about 1.2 points. No other pillar rose: the lowest one carried the index over 80.
The reverse also happens. In the window the index marks for the Red Sea diversions, 15 December 2023 to 30 June 2024, the shipping pillar was at 80 or more on 104 of 141 weekdays and peaked at 88.5. The headline was in Normal on all 141 and averaged 52.5. The weights set the limit: with the other four pillars at 50, a shipping pillar at 100 lifts the index to 62.5. In the file as a whole, at least one pillar was at 80 or more on 1,099 days when the headline was in Normal or a lower band.
The methodology page’s answer: “To keep a single-pillar crisis from being averaged out of sight, the index page shows each pillar and how many are in severe territory.”
Three or more pillars were at 80 or more on 379 days, and the headline was Severe on 68
When any pillar is at 80 or more the index page prints how many; for the reading of 9 October 2026 it was three of five. Three or more pillars were at 80 or more on 379 of the file’s 4,898 days, counting three of the four that exist before 30 January 2019. Of the 379, 36 are in the reference decade, and 203 are every weekday from 31 December 2025 to 9 October 2026. On 311 of the 379 the headline was below 80.
A pillar at 80 or more is not rare: at least one was there on 1,035 of the decade’s 2,608 days.
What separates the 68 is the average, which also counts how far above 80 the high pillars are and how low the others sit. All 68 Severe days had at least three pillars at 80 or more; six had four; none had all five. From 13 March to 9 October 2026 at least three pillars were at 80 or more on every weekday, and the headline was Severe on 68 of the 151 and Elevated on 83.
A number printed before October 2026 is on a different scale
The index described here is version 3, which the methodology page dates to October 2026. Version 2, which that page says was published from July to August 2026, had four components and ranked each against a rolling five years. Its history is kept as an archive that ends on 17 August 2026, and the methodology page is plain about it: “The two versions are not comparable and should not be spliced.”
The trap is that the two share their words. Both files use the same five band names, and version 3 has its own row for every date in the archive, so each of those dates has two readings, one in each file.
A reading of the index in a piece this site published before October 2026 is from before version 3. Two of those pieces are about the index itself, of 29 July and 19 August 2026, and both quote version 2. No version 2 reading is quoted here. Four figures with a decimal point are printed both in those pieces and in this one; each is a different quantity on a different scale.
What this cannot settle
Its specification says it measures friction, not the volume traded. The methodology page’s words: “This index measures friction in moving and paying for goods, not the volume traded.” One of the ten inputs is built from a volume, the IMF’s estimate of what ships carry through each chokepoint. It enters only as a shortfall against that chokepoint’s own 2019–October 2023 average, and a route above its average counts as zero, so cargo that has moved to a route at or above its average still scores as missing and the total passing all chokepoints is not scored. The code fetches no series of trade by value except US goods imports, which is only the denominator of the tariff rate, none of services trade and no freight rate. The index page lists services trade and a daily freight rate among the things it cannot see; the methodology page says freight costs enter monthly, inside the supply-chain series.
Two of the five pillars are measured in the United States. The tariff rate is the US rate and the uncertainty index reads US newspapers; financial stress, the methodology page says, “is read through US markets”. No other country’s tariff is an input.
The newest rows are provisional. The index’s figures here are from the build of 13 October 2026, 02:16 UTC. Each build recomputes every weekday from 2 January 2008, giving each day every input’s latest observation dated on or before it. In that build only the VIX was observed on 9 October. Seven other inputs were last observed between 2 and 8 October, and the monthly uncertainty figure was August’s, so the 29 rows from 1 September 2026 all wait for a later one. Nine of the 68 Severe days are among those rows, and seven of the 29 are no more than half a point from 80. The 82.3 for 9 October, the count of 68 and the crossing on 1 October can therefore differ in a later build, and Brent’s $104.1 and $188.8, which are in August 2026 dollars, are restated with each new month of consumer prices. The count for 2010–2019 does not rest on those rows. Its highest day is 1.6 points below 80, and it can still move if a publisher revises its past figures.
Every row is back-calculated. Version 3’s first build is dated 10 October 2026 and ended at 8 October, so none of the 66 Severe days before 8 October was printed on its day. Readings before 2020 are, in the methodology page’s words, “scored against a decade they partly sit inside”.
Ships that switch off their transponders are not counted. The methodology page again: “A vessel with its transponder off is not counted. Where ships run dark, the shipping pillar understates the disruption.”
It says nothing about what comes next. The methodology page: “It is not a forecast. A high reading describes conditions now.”
The edges are not exact. The file sets a day’s band before it rounds the reading to one decimal, so 20 of the 4,898 rows are printed as exactly 60.0, 40.0 or 20.0 and carry the band below. The one row printed as exactly 80.0, 27 May 2026, is in Severe.
Where to follow it
The reading and its parts. On the index page, the section headed The five pillars gives each pillar’s score, band and weight beside a meter and, in a table that opens under each, its inputs with the date each was observed. The same figures are in ttsi.json, which lists a warning for any input older than its expected lag.
The week’s change. The weekly piece, published on Mondays, reports the seven-day change in the index. The issue for the week to 11 October 2026 quoted version 3 at 82.5 for 8 October. In the 13 October build the reading for 9 October is 82.3, 2.3 points above 80 and 4.4 below the record.
Forecasts are somewhere else. The site’s forecasts are on the outlook page, and the Stress Index is not one of them.