Analysis
All published analysis, most recent first. Every figure traces to a named public source, and every piece is anchored to the stress index.
- Europe's gas price was 8.6 times America's, most since March 2022Markets
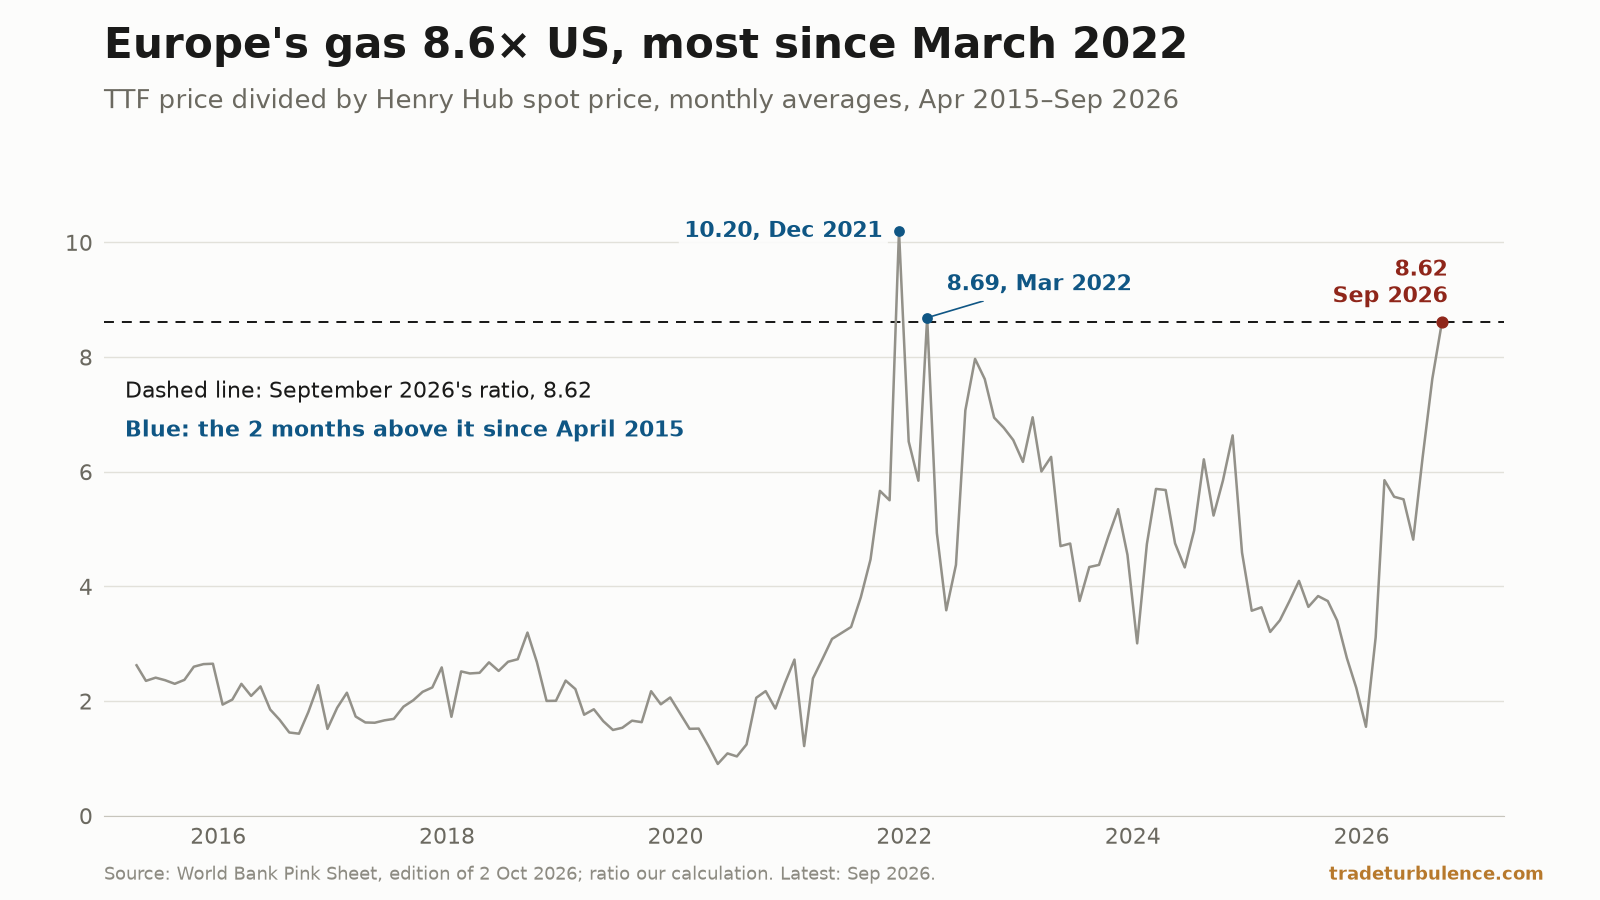
Europe's gas price averaged $25.42 per mmbtu in September 2026, 8.62 times the US's $2.95, World Bank data show. The ratio was last higher in March 2022.
- Four staple crops last rose this much together in February 2021Geopolitics & trade
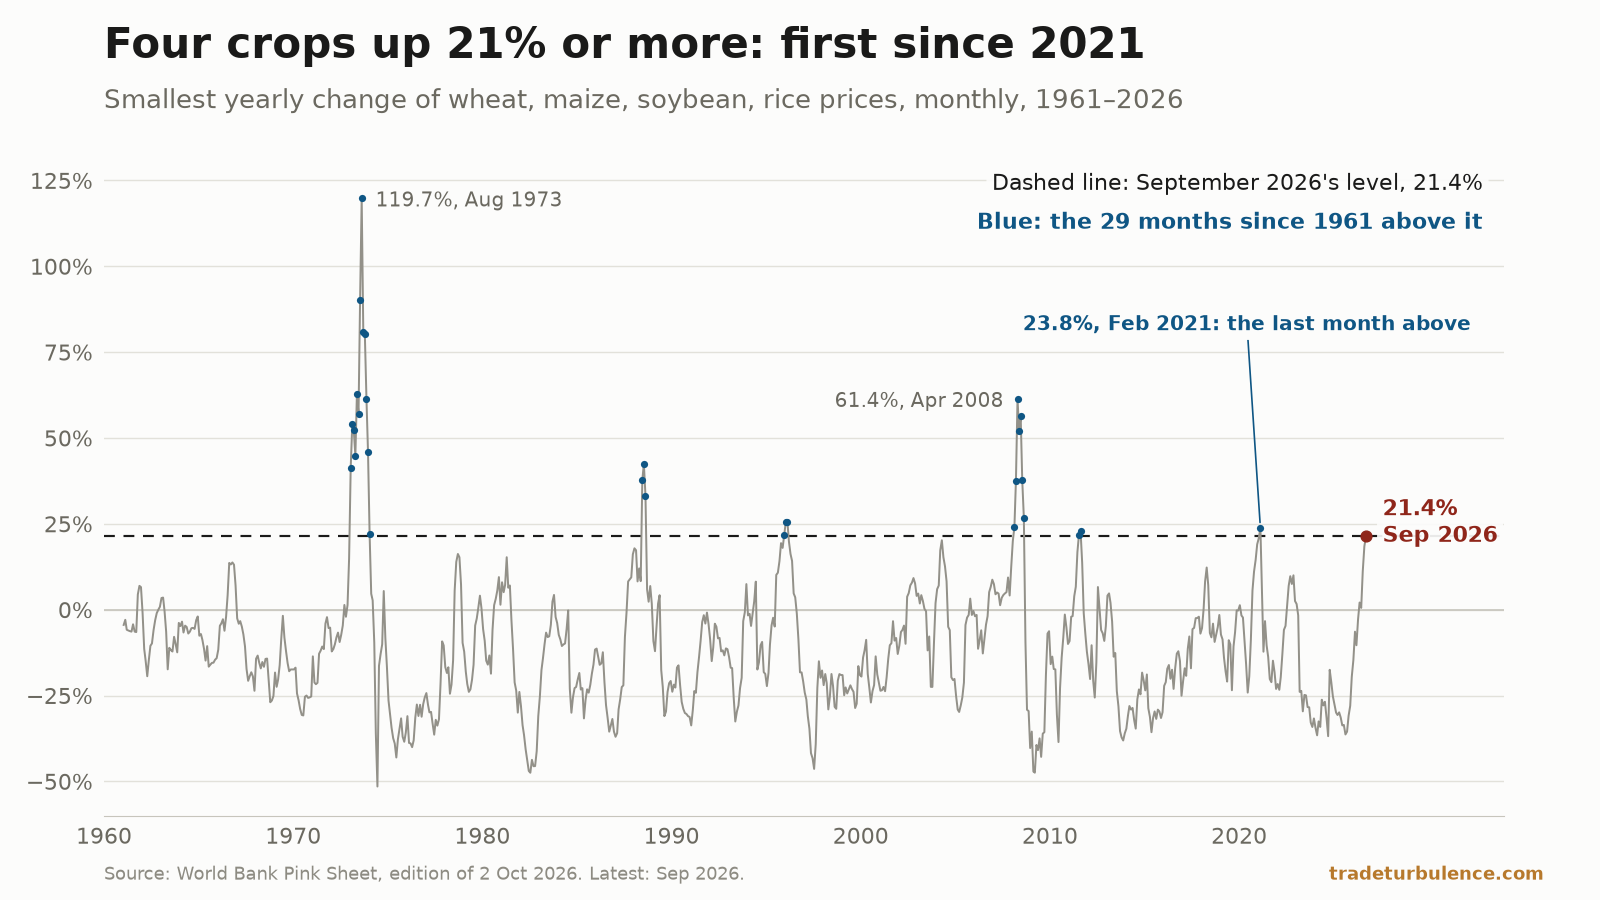
Wheat, maize, soybeans and rice each cost at least 21% more in September 2026 than a year earlier, World Bank data show. That last happened in February 2021.
- Without computers, chips and fuel, US import prices rose 3.9%Macroeconomics & policy
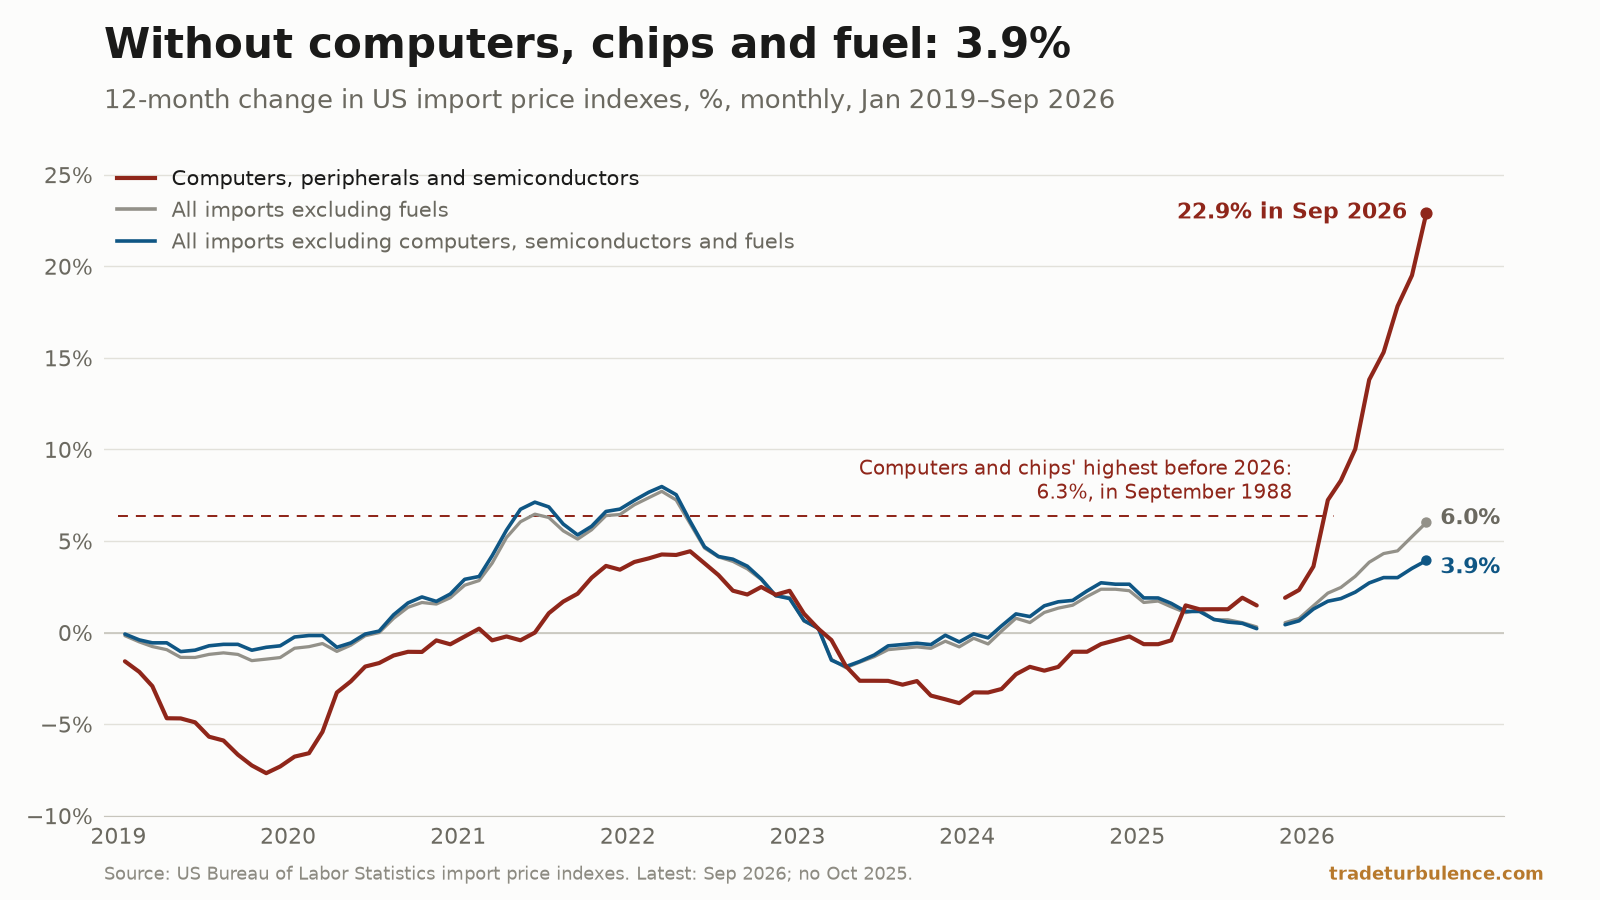
Outside fuel, US import prices rose 6.0% in the year to September 2026; without computers and chips too, 3.9%. Theirs rose 22.9%, most in BLS data from 1984.
- In 18 days, the Bering Strait beat every earlier OctoberGeopolitics & trade
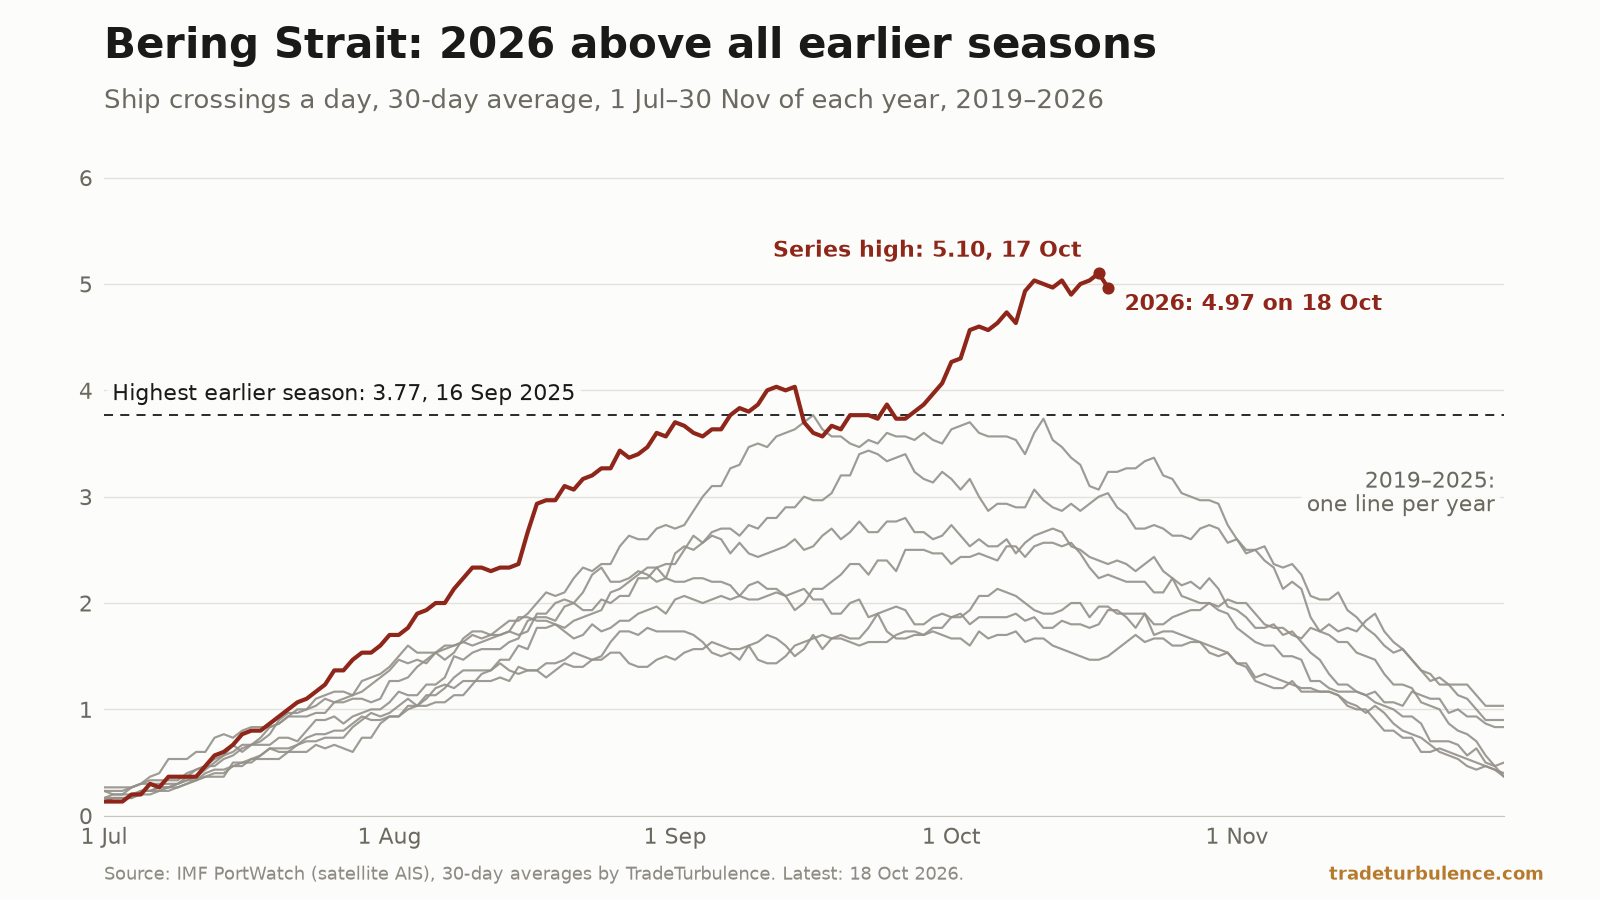
Ships crossed the Bering Strait 95 times on 1–18 October 2026, more than in any full October in PortWatch's count since 2019. The busiest, in 2025, had 88.
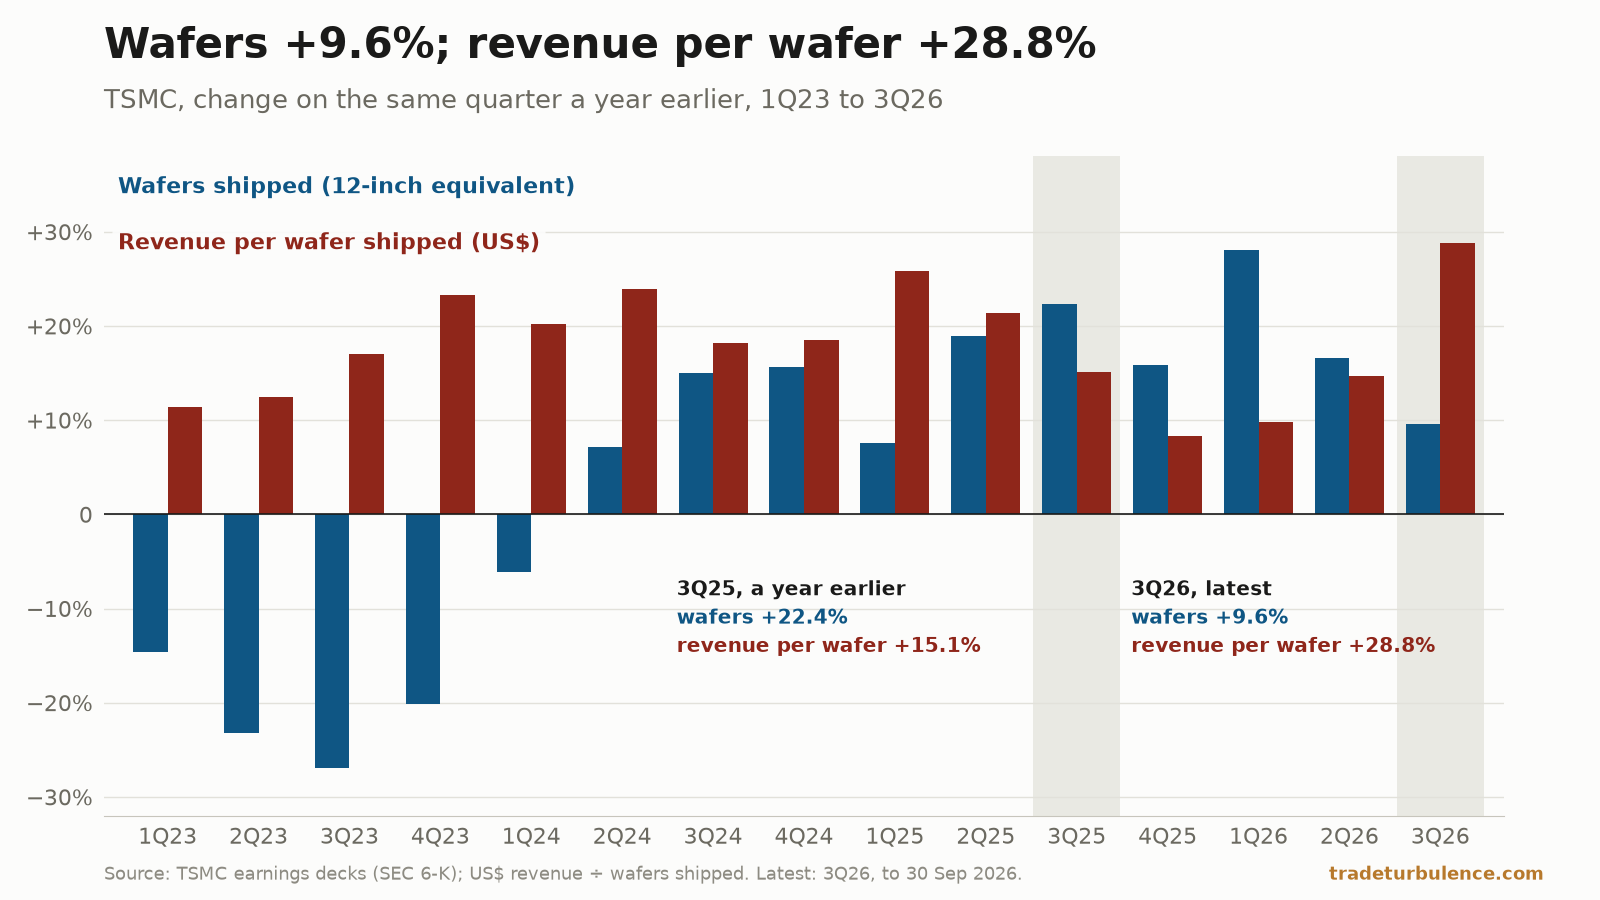
- TSMC shipped 9.6% more wafers. It took in 41.2% more dollarsAI and compute
TSMC took in 41.2% more dollars in July–September than a year earlier, on 9.6% more wafers. Revenue per wafer rose 28.8%, its biggest rise in 15 quarters.
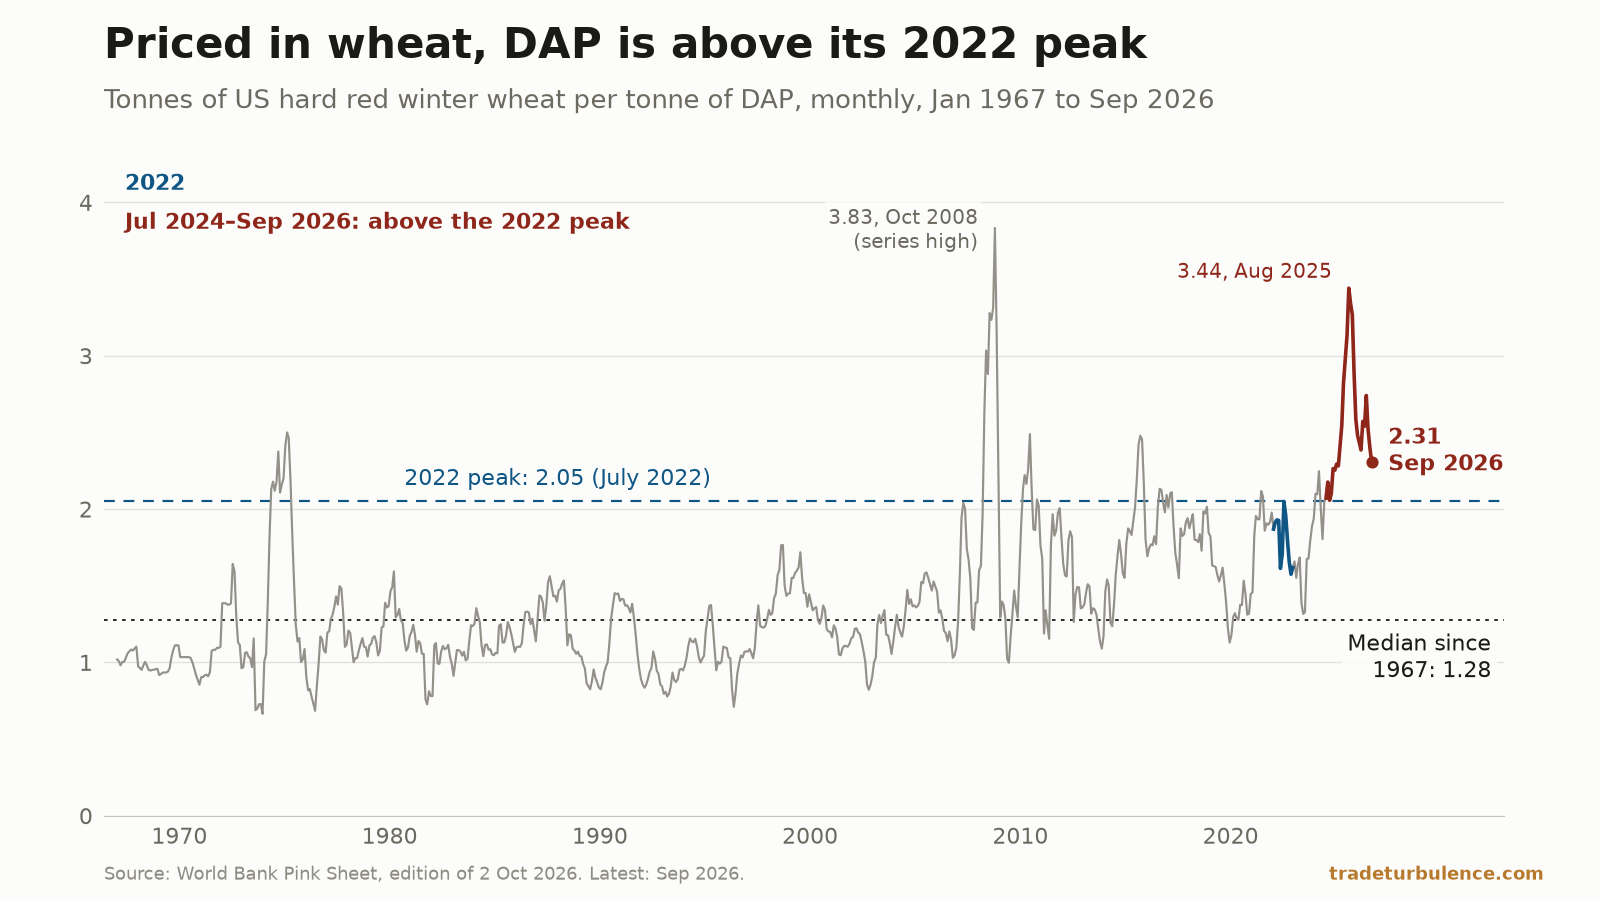
- DAP is below its 2022 peak. Priced in wheat, it is above itGeopolitics & trade
DAP averaged $800.6 a tonne in September 2026, 16% below its 2022 peak, World Bank data show. A tonne cost 2.31 tonnes of wheat, more than in any month of 2022.
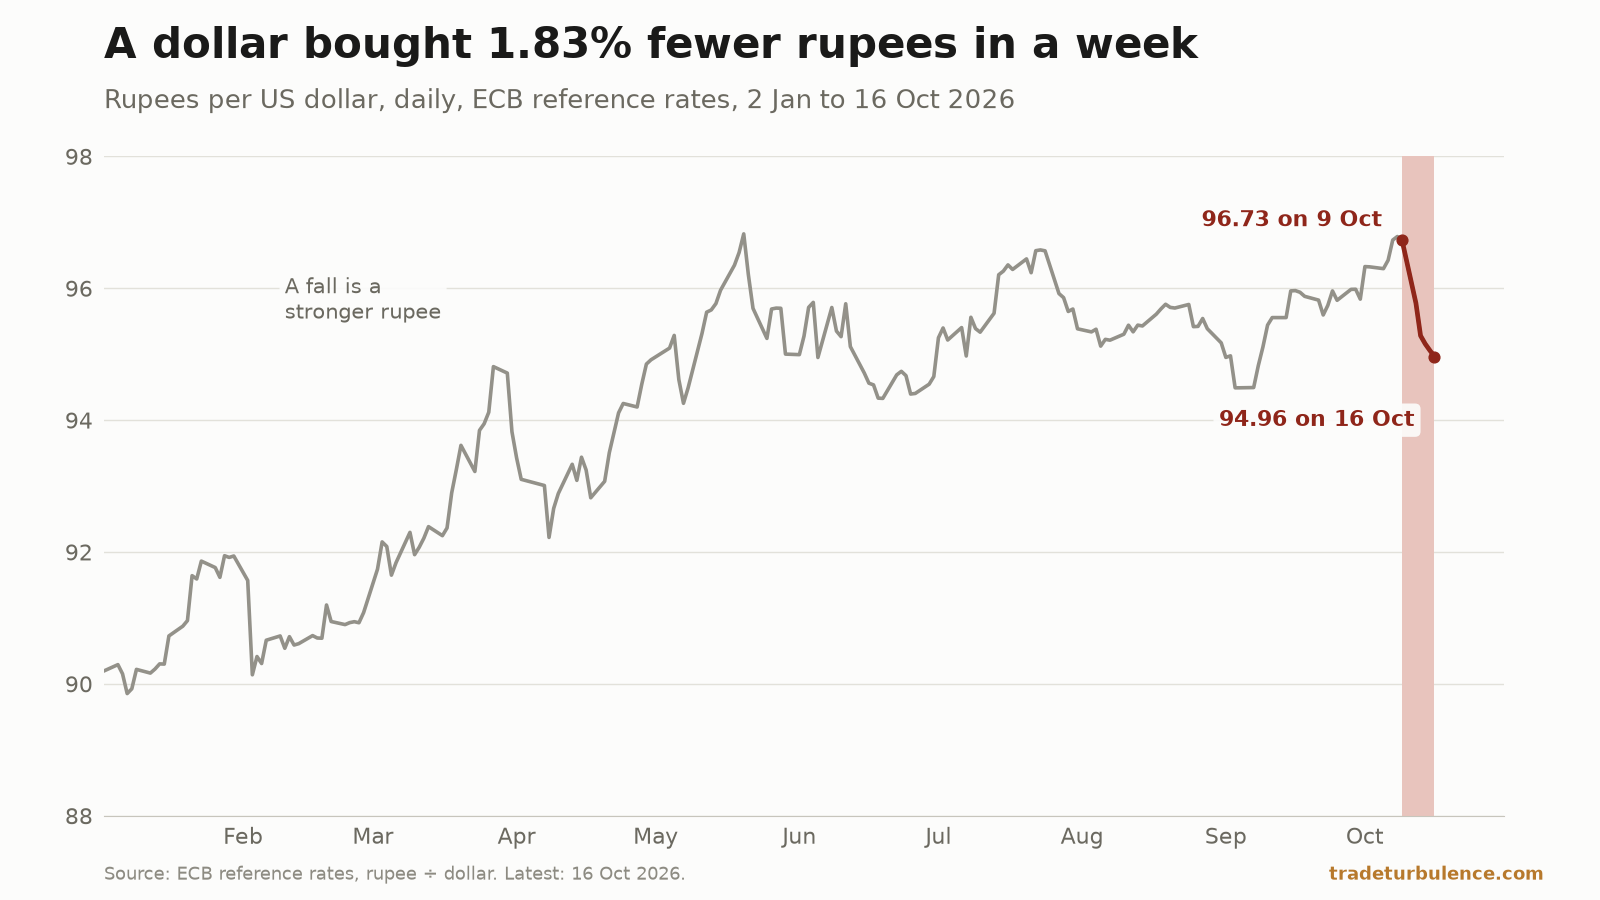
- The rupee gained 1.8% in a week. It is still weakThe week
On ECB rates a dollar bought 1.83% fewer rupees on 16 October than a week before, the most of 29 currencies. Only 96 days in five years had a weaker rupee.
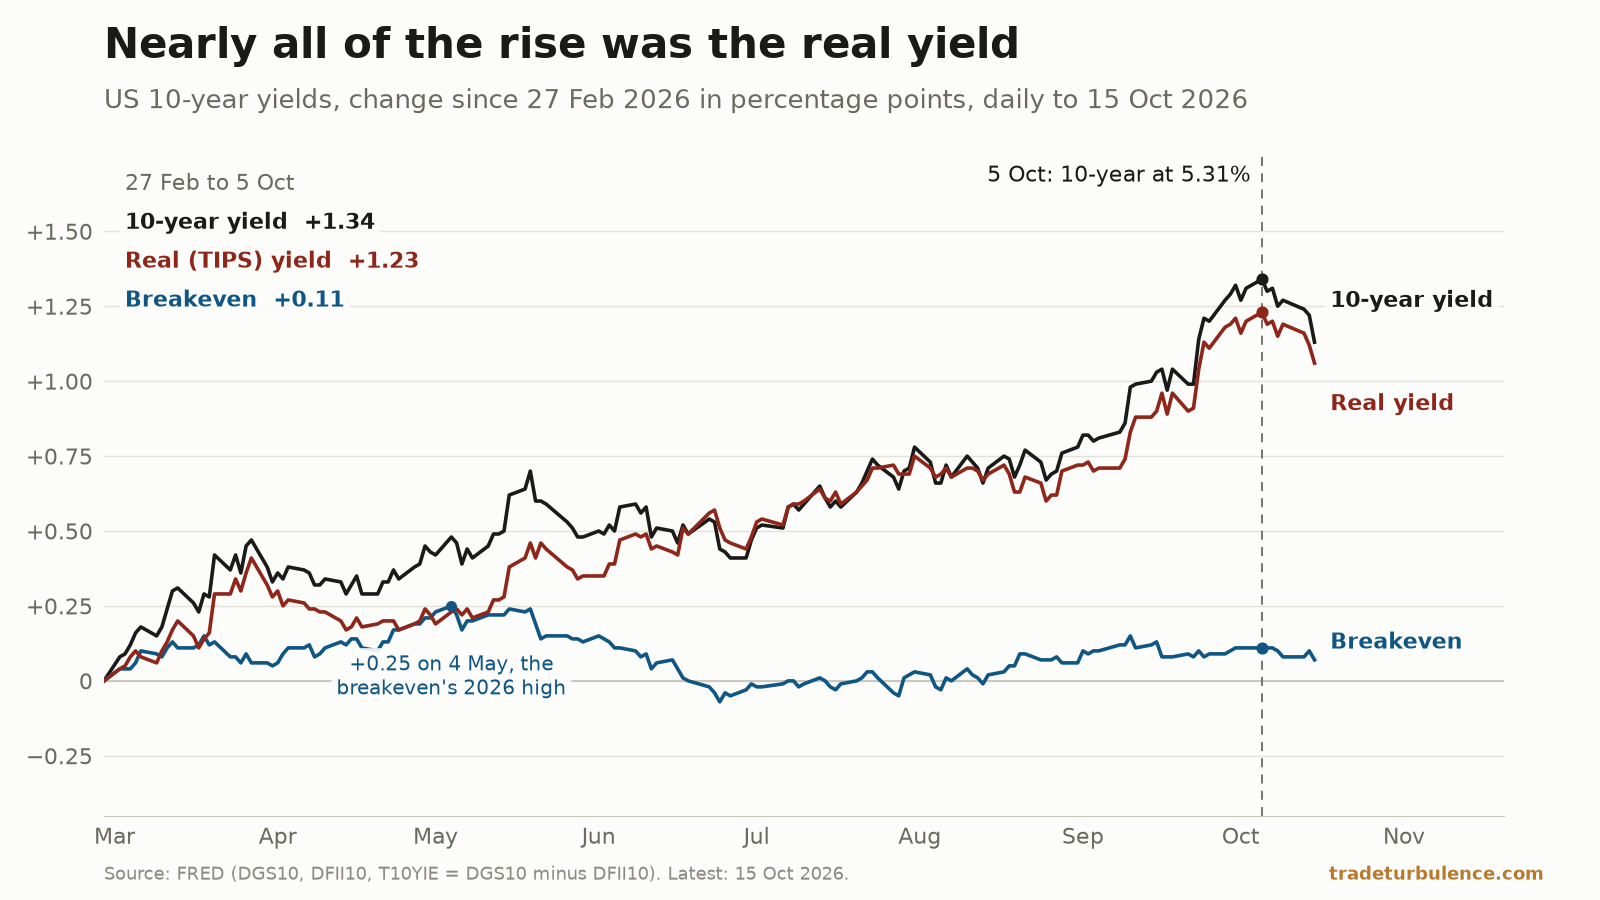
- The 10-year rose 1.34 points. The real yield was 1.23 of themMacroeconomics & policy
The US 10-year yield reached 5.31% on 5 October 2026, its highest since May 2002. Of its 1.34-point rise from 27 February, 1.23 points was the real yield.
- Trump waived a 100% tariff on Russia's top oil and gas buyers. Rubio named IndiaOn the record
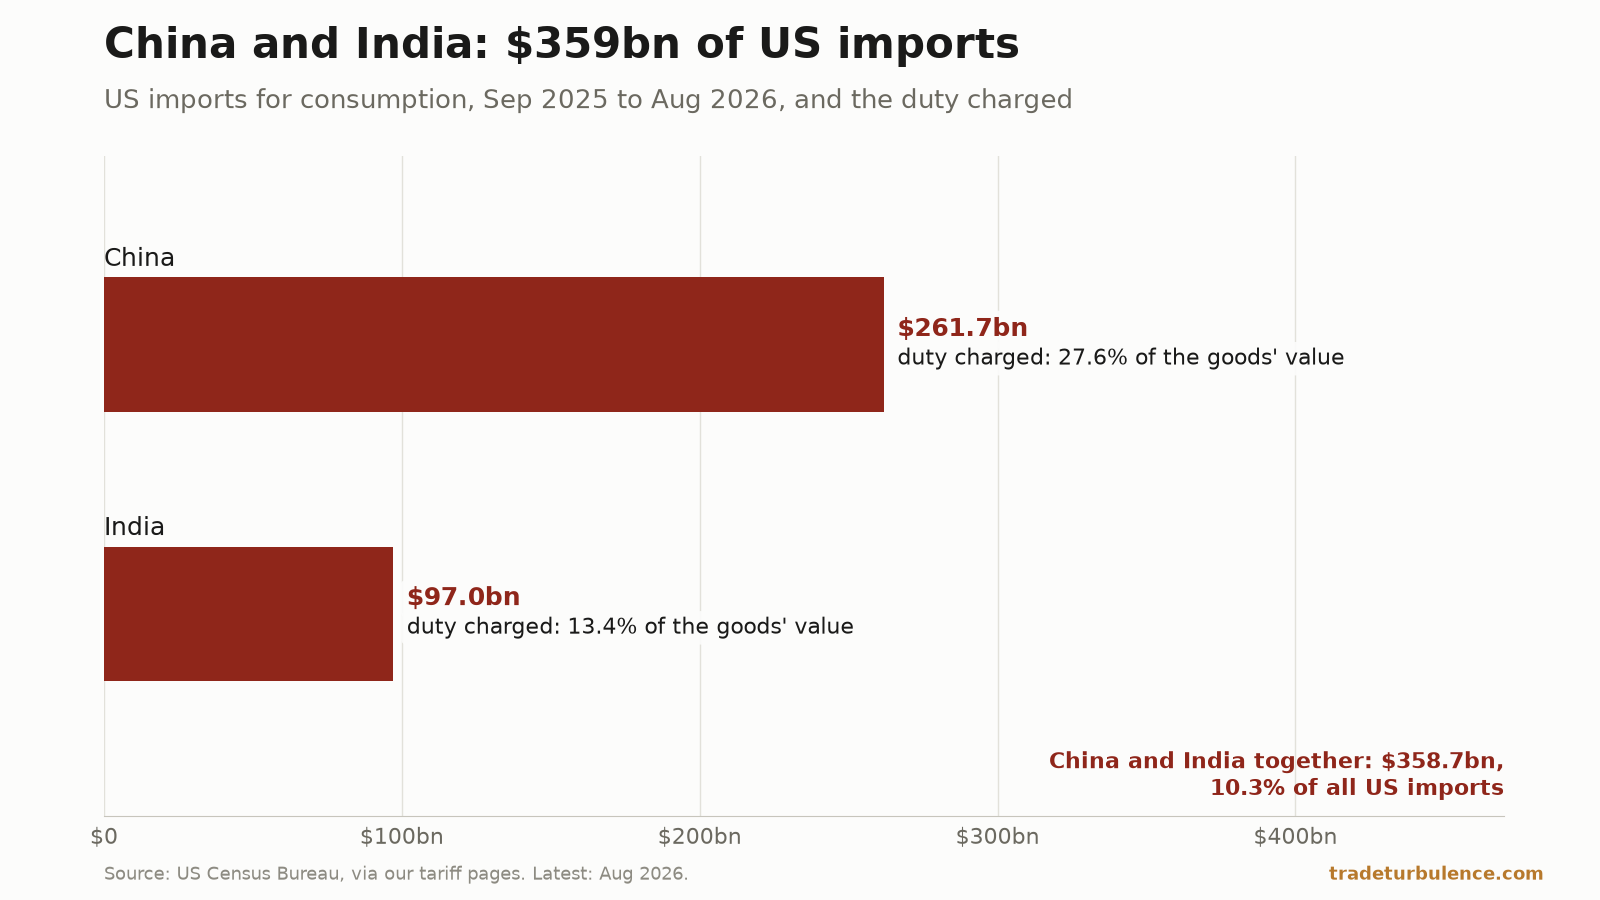
The order names no buyer. China and India, the top buyers in importers' 2025 UN returns for Russian crude, sold the US $359bn of goods in the year to August.
- Euro-area inflation is 3.8%. Without energy, it is 2.3%Macroeconomics & policy
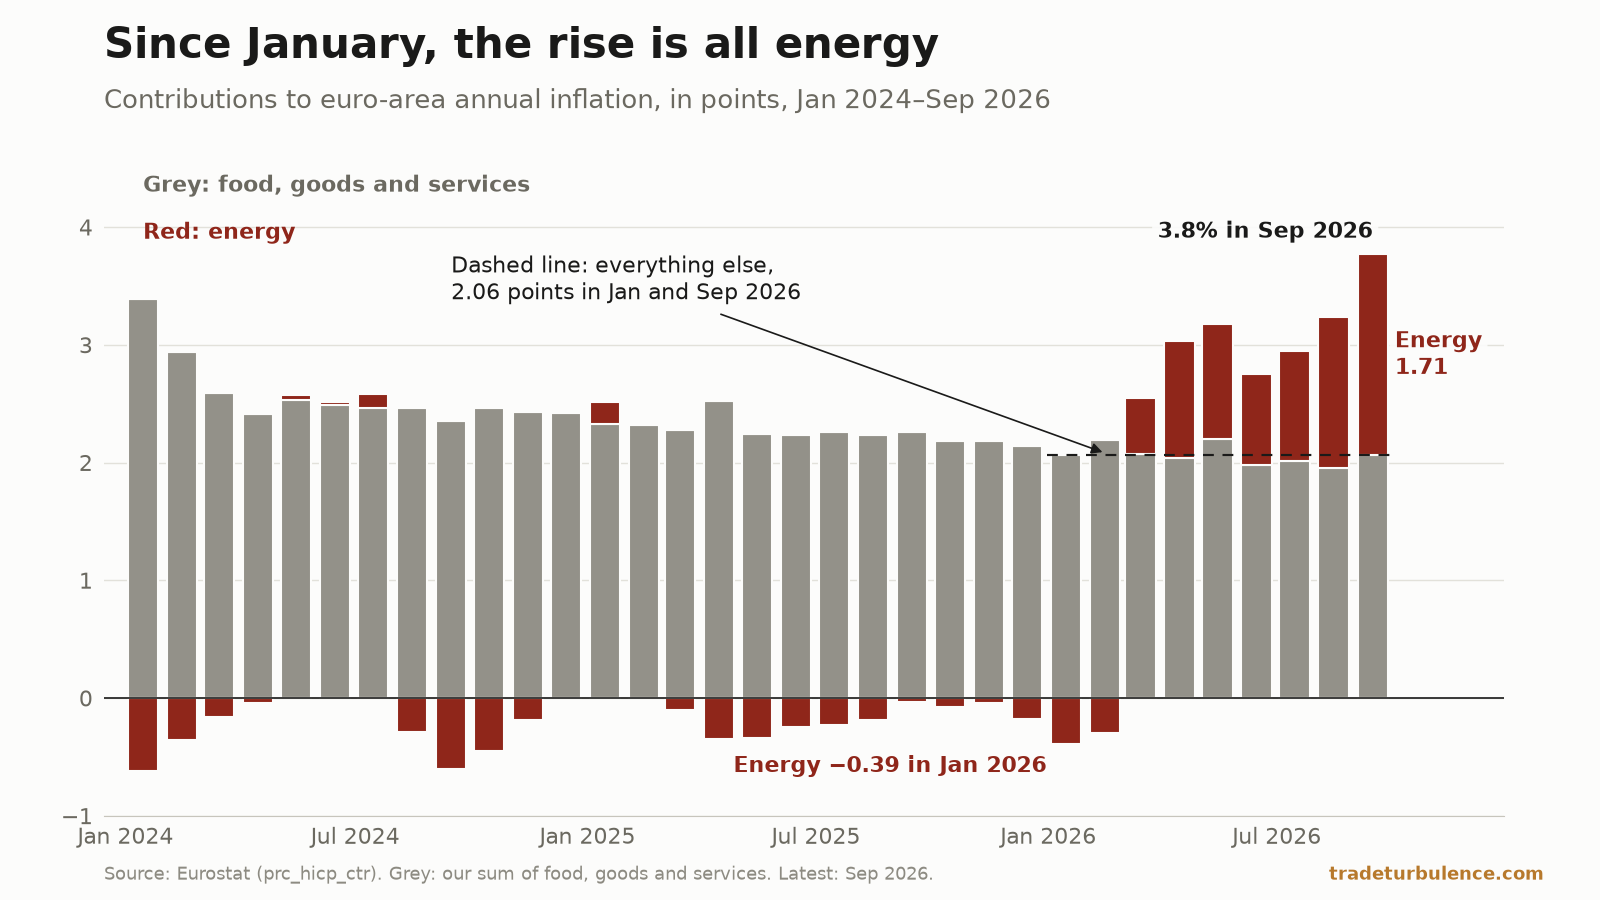
Euro-area inflation was 3.8% in September 2026. Excluding energy it was 2.3%, as in January; transport-fuel prices were the highest in Eurostat data from 1996.
- Copper is a record in real terms. Most base metals are notMarkets
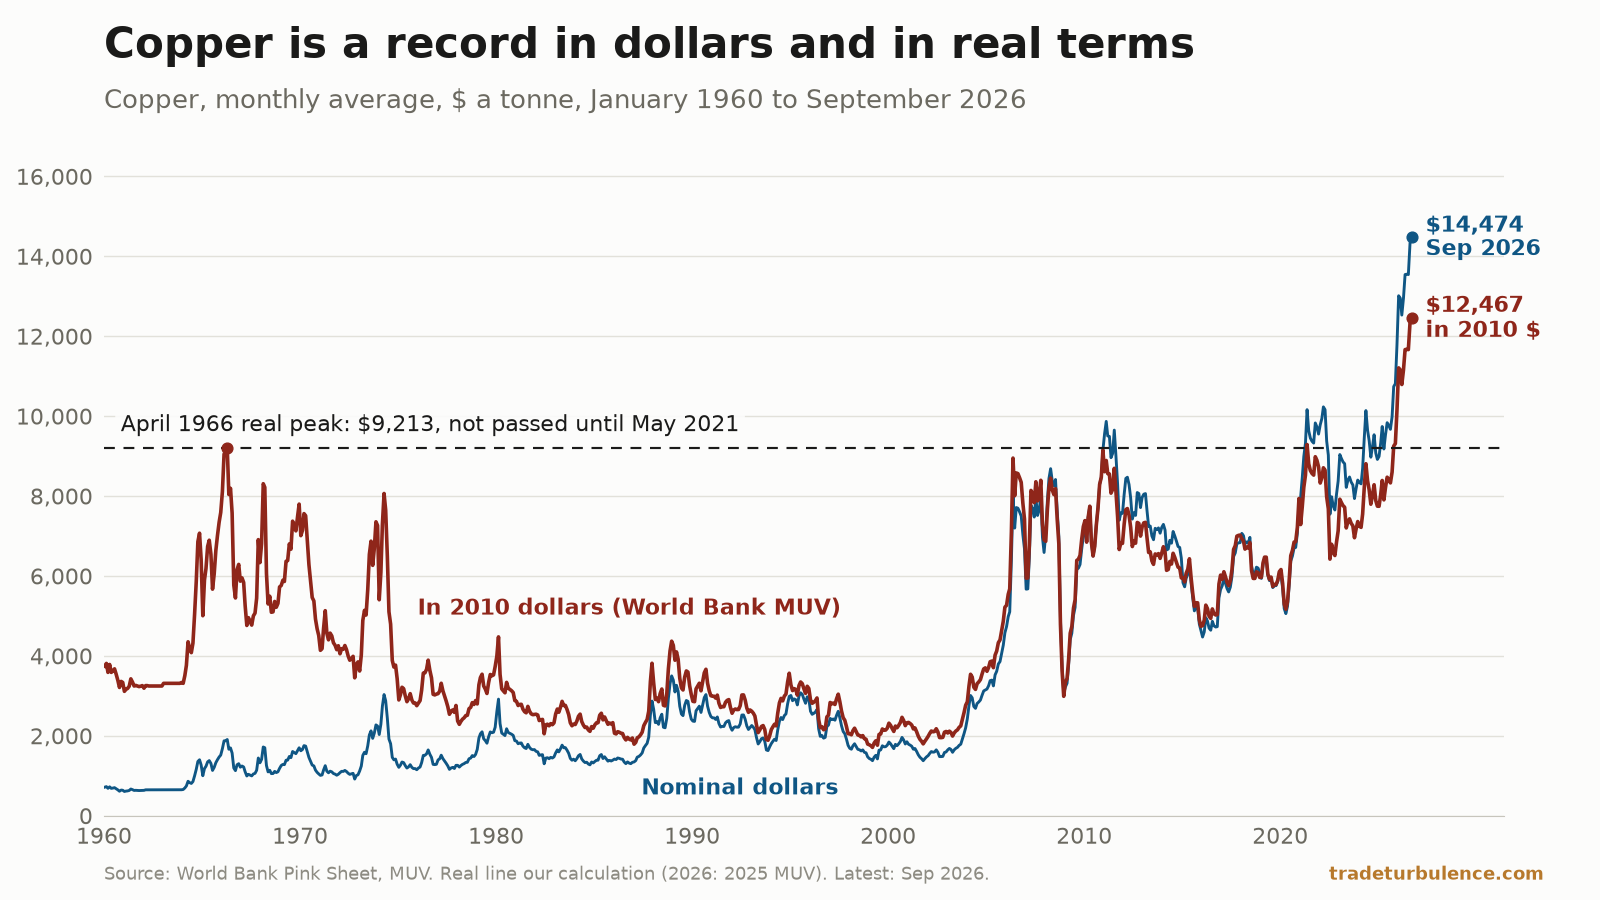
Copper averaged $14,474 a tonne in September 2026, a World Bank record from 1960 and a real one on our deflation. It gave 65% of base metals' 12-month rise.
- Bab el-Mandeb fell below its 2024 low. Suez did not.Geopolitics & trade
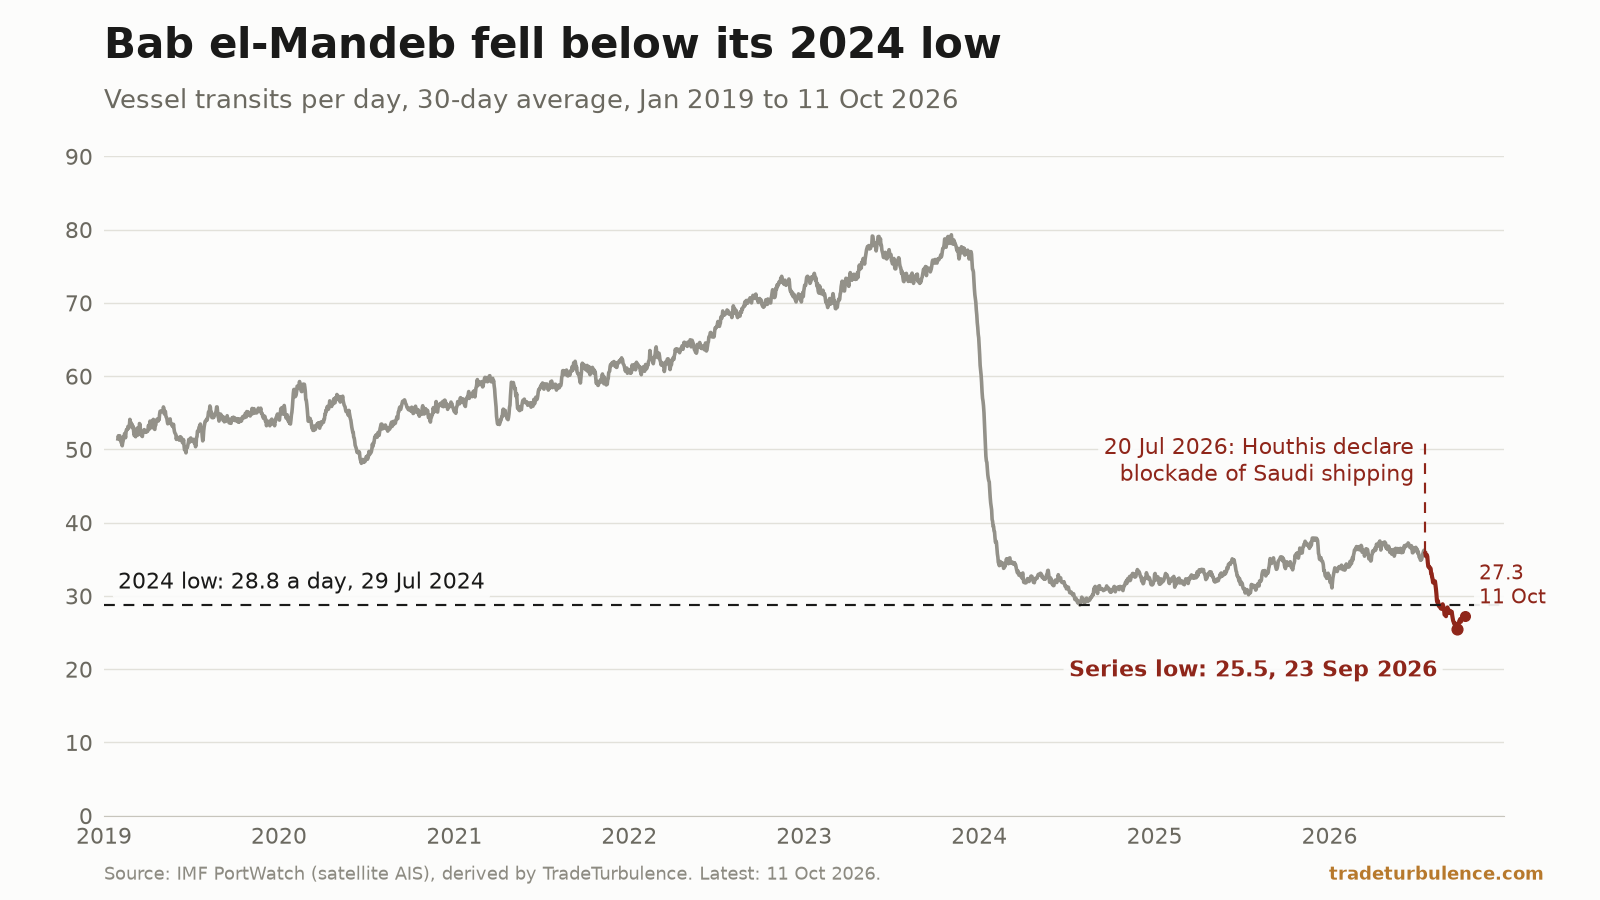
Bab el-Mandeb's 30-day traffic hit 25.5 transits a day on 23 September, the lowest in PortWatch's series from 2019. Tankers were 61% of the fall. Suez held.
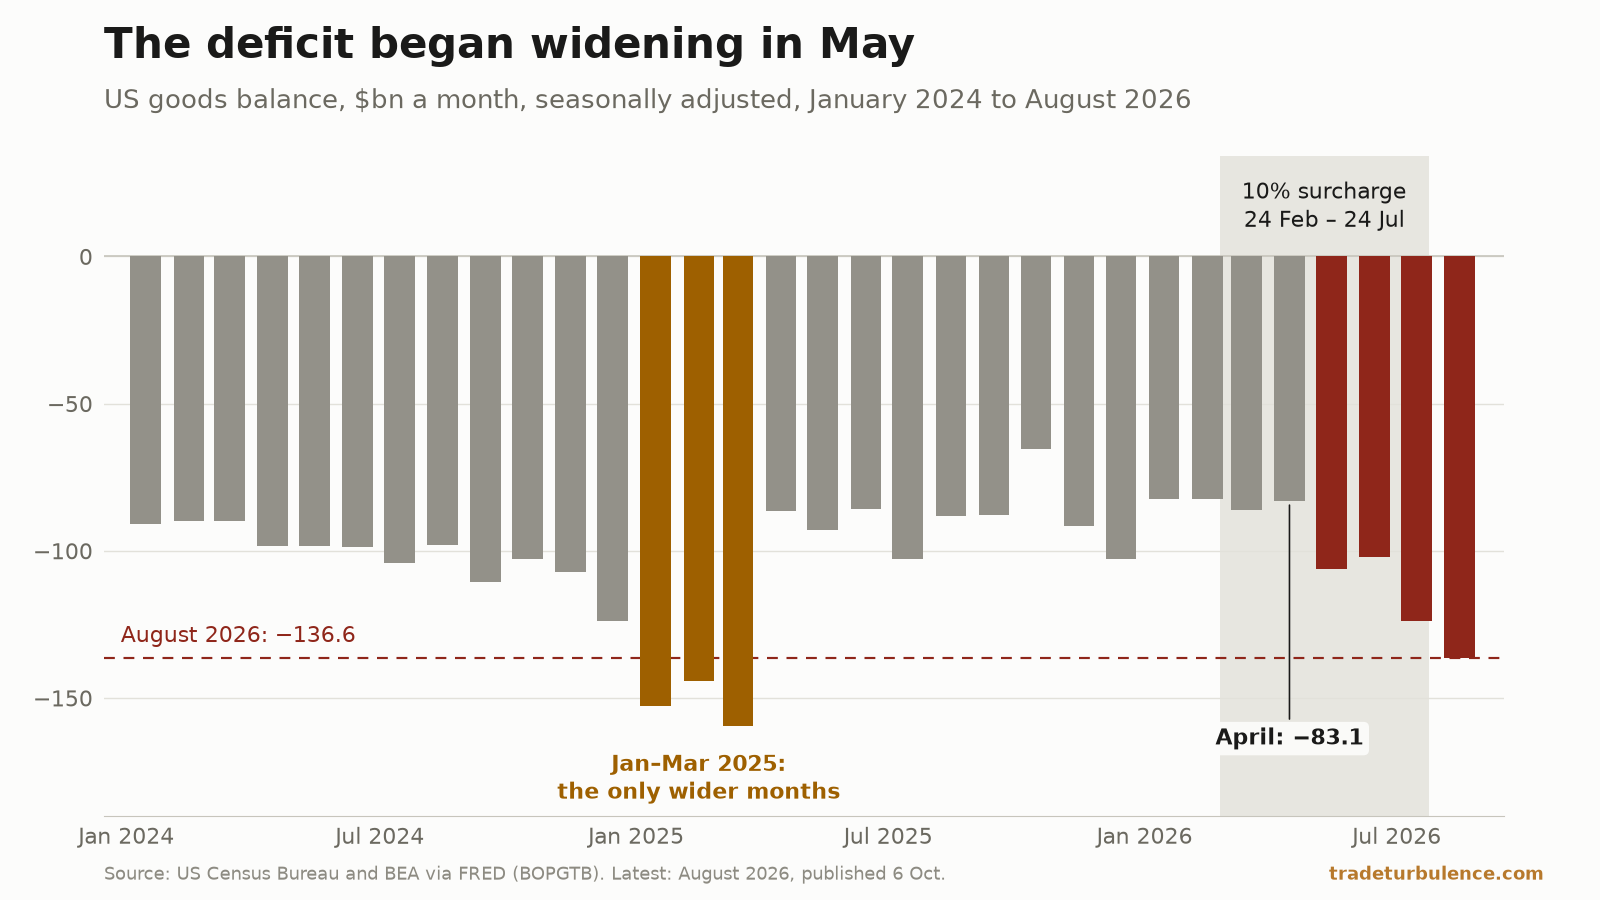
- The surcharge ended in July. The deficit began widening in May.Macroeconomics & policy
The US goods deficit reached $136.6bn in August, its widest since March 2025. Of the $53.5bn widening since April, $40.7bn was in the data by July.
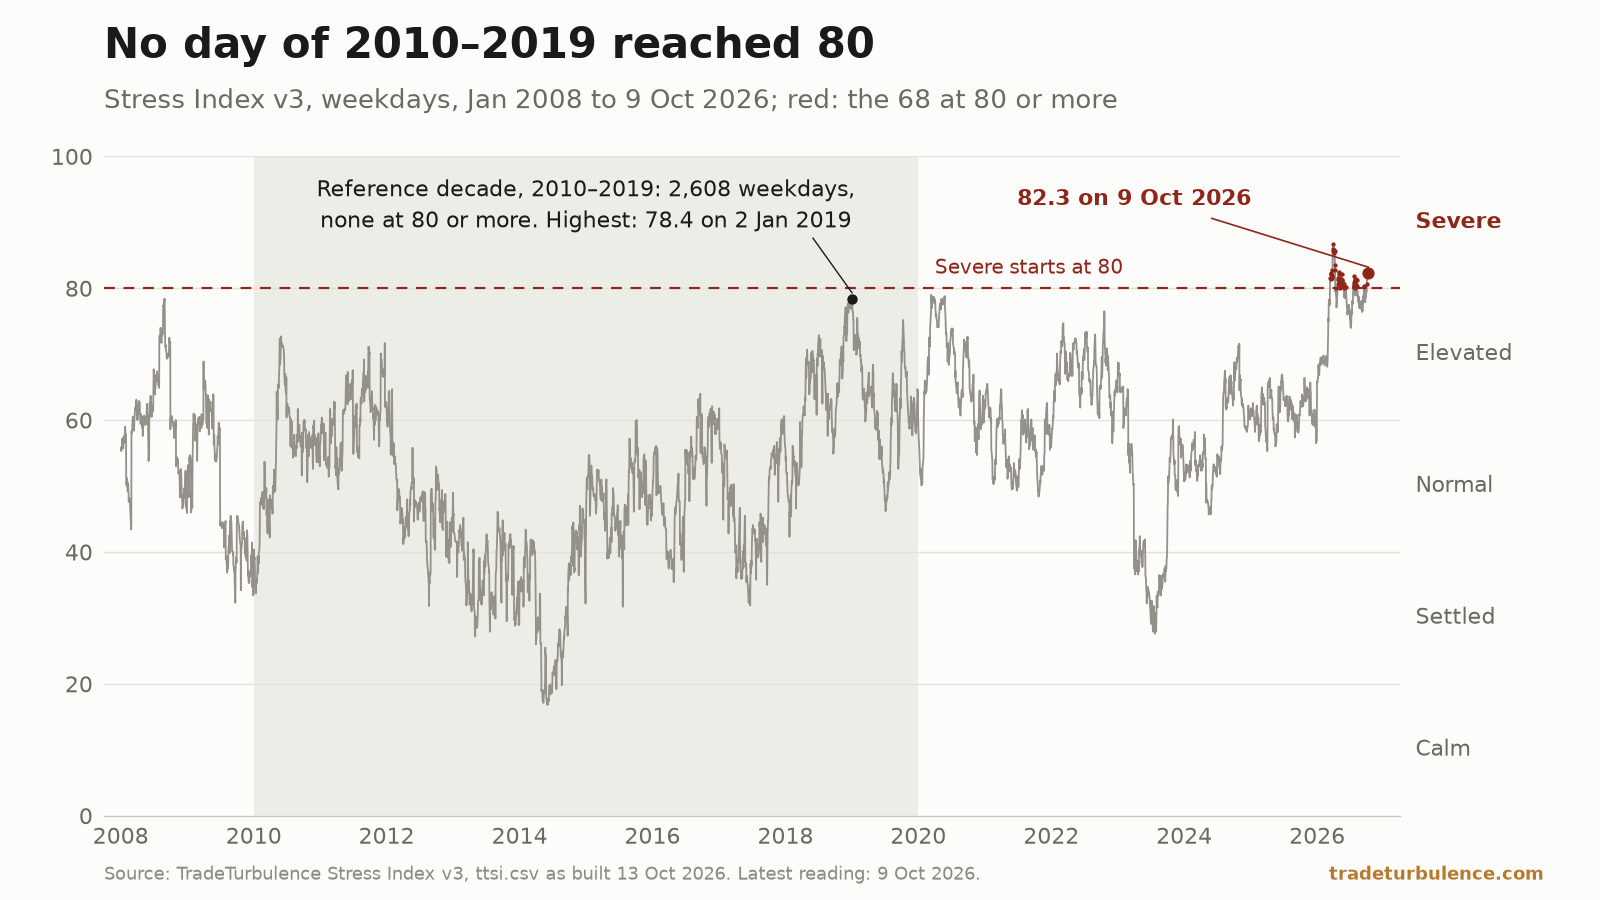
- A Stress Index of 80 is higher than any day of 2010–2019Explainers
Severe starts at 80. No weekday of 2010–2019 reached it. As built at 02:16 UTC on 13 October 2026, 68 weekdays of 2026 had; version 3 read 82.3 for 9 October.
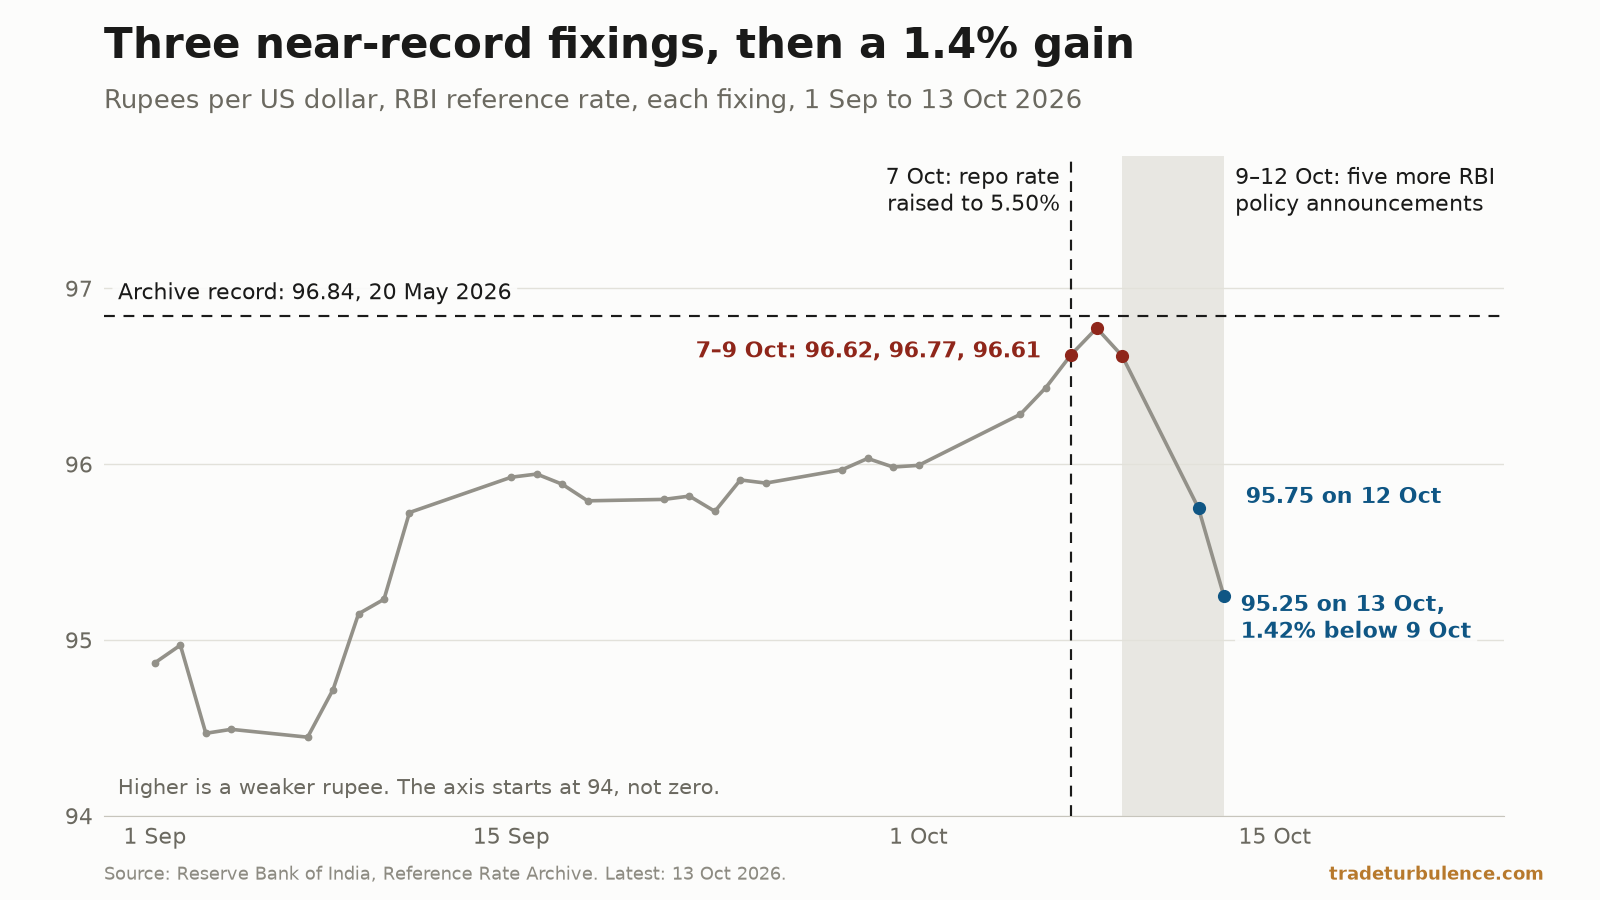
- The rupee fell through a rate rise, then rose 1.4% in two fixingsMarkets
Three of the RBI archive's four weakest rupee fixings came on 7–9 October. From the 9th to the 13th, across five policy announcements, the rupee gained 1.4%.
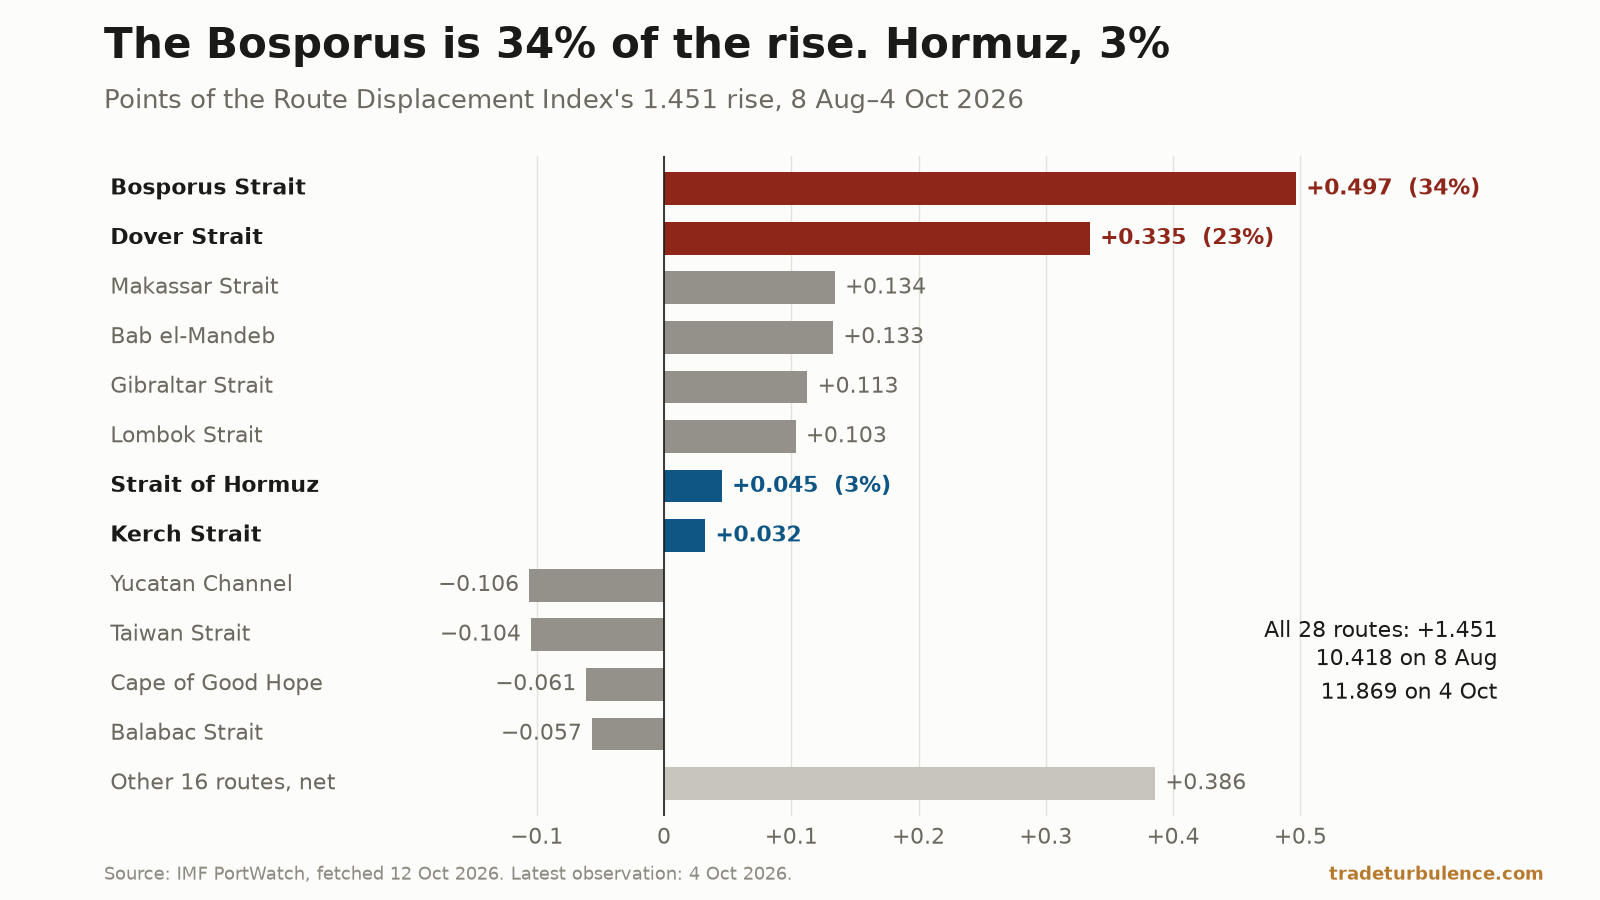
- The Bosporus is 34% of the rise in route displacement. Hormuz, 3%Geopolitics & trade
On counts fetched 12 October, the Route Displacement Index rose from 10.42% on 8 August to 11.87% on 4 October. The Bosporus and Dover supplied 57%; Hormuz, 3%.
- Brent rose 10% in a week. In rupees it set a recordThe week
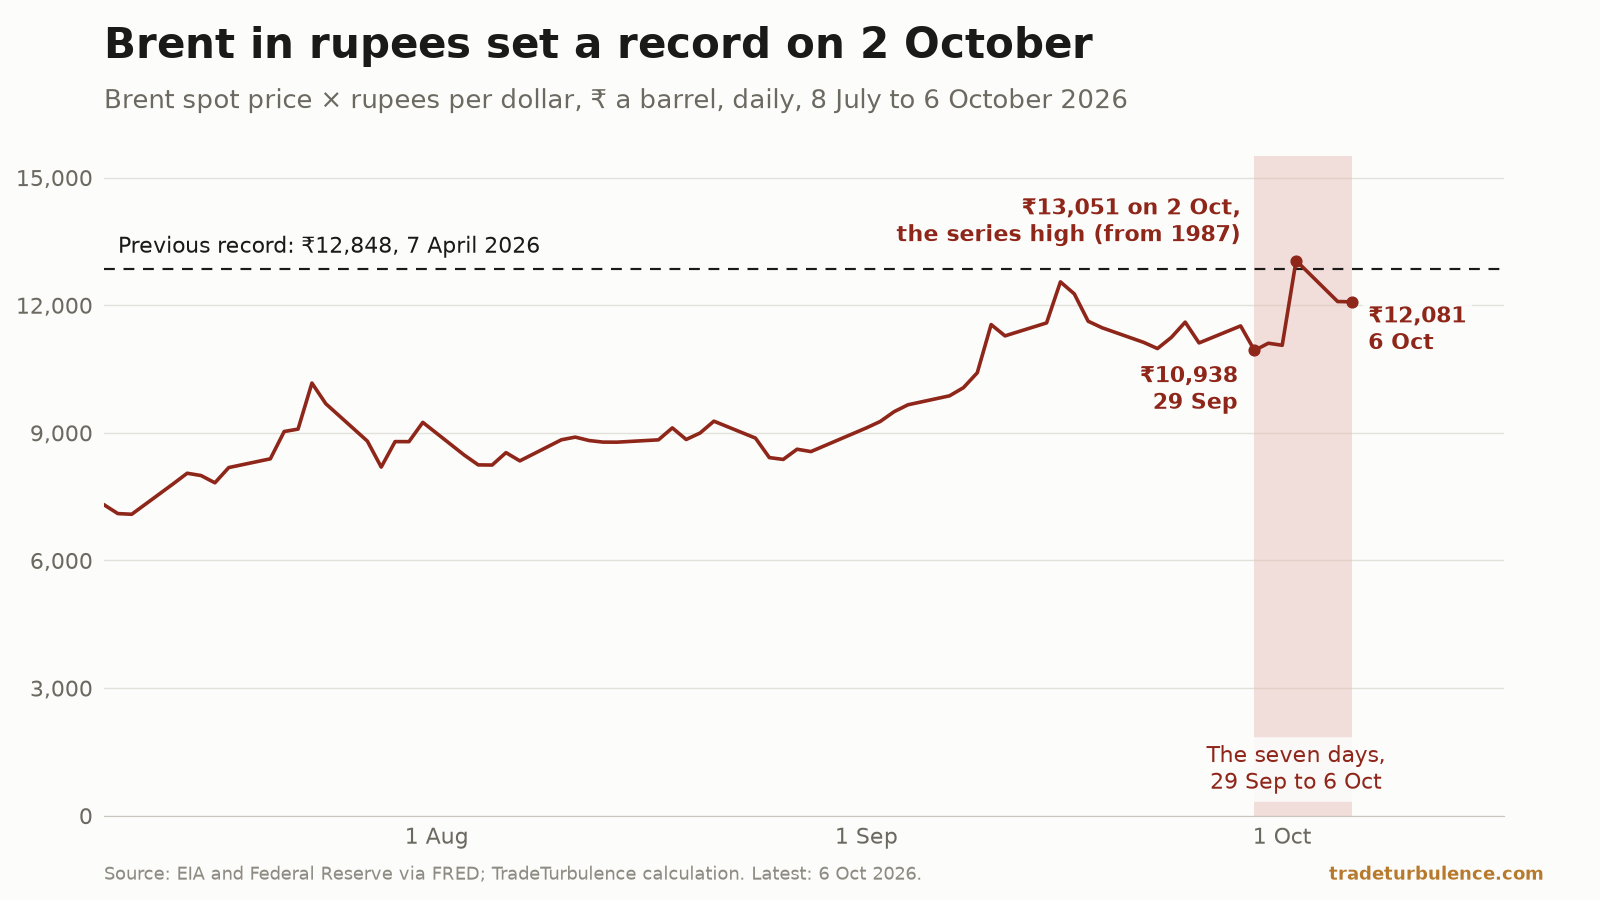
Brent was $125.44 on 6 October, 10.1% above 29 September. On 2 October a barrel cost ₹13,051, the most in a series from 1987; by 6 October, 7.4% less.
- Brent rose 23% in a month. The Hormuz counts point both waysMarkets
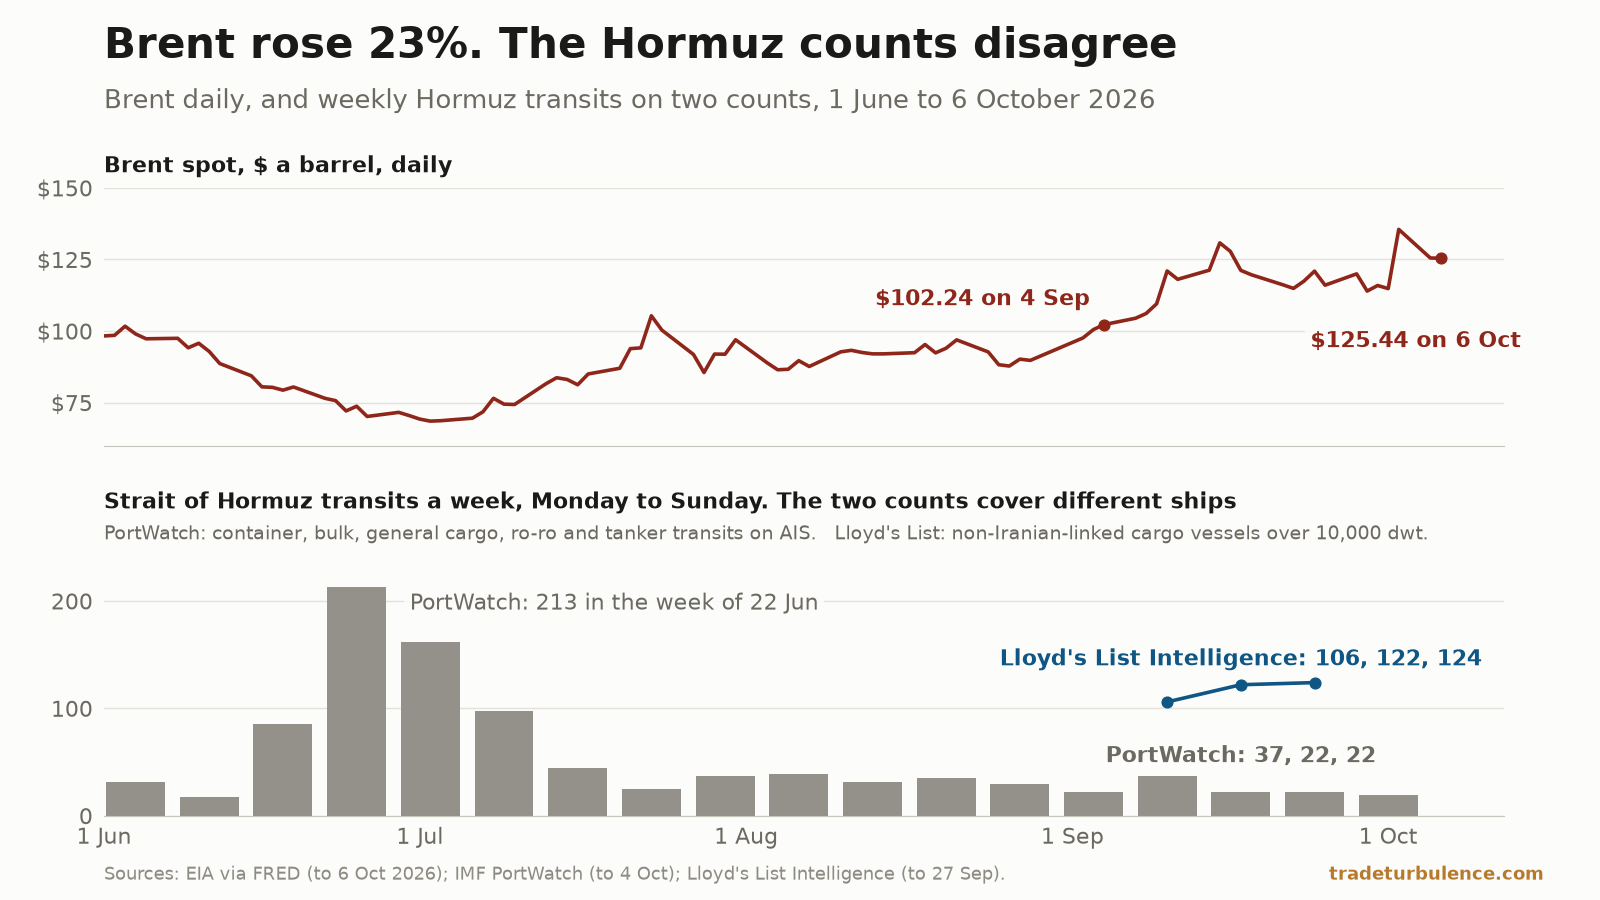
Brent rose 22.7% from 4 September to 6 October. PortWatch has 109 Hormuz transits in September; Lloyd's List, counting a different set of ships, at least 477.
- The Rhine at Kaub has spent 41 days below its 2018 recordGeopolitics & trade
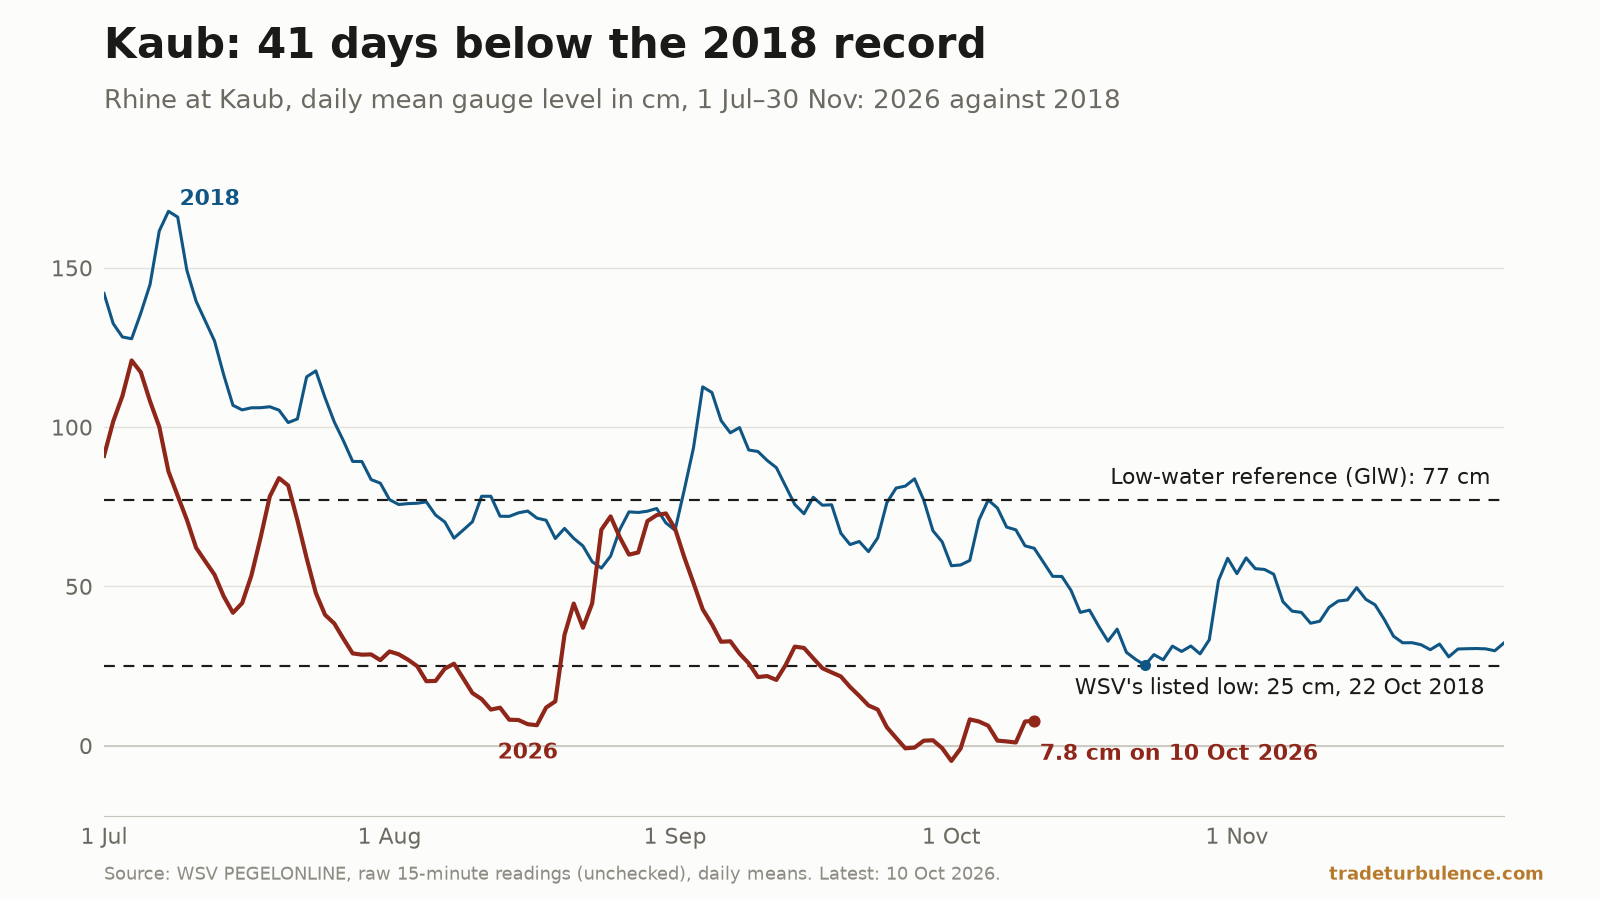
The Kaub gauge averaged 7.8 cm on 10 October, its 41st day of 2026 below the 25 cm low of 2018. From 2000 to 2025, no day in the agency's data was under it.
- The index went calm the week oil went violentMacroeconomics & policy
The Stress Index printed Settled on 12 August with its energy score above 90. In 4,814 trading days since 2008, that pairing had never appeared before.
- Kerch now moves in a month what it once moved in a dayGeopolitics & trade
In the 30 days after Russia's 10 July suspension notice took effect, 34 vessels passed the Kerch Strait. Its 2019–23 baseline moved 37.4 in an average day.
- The dollar is at its 24th percentile. The rupee is at its 97th.Markets
The broad dollar has closed below every session of 2024 and 2025, yet the rupee and yen sit in the weakest tenth of their five-year ranges against it.
- The surcharge ran 150 days. The deficit did not narrow.Macroeconomics & policy
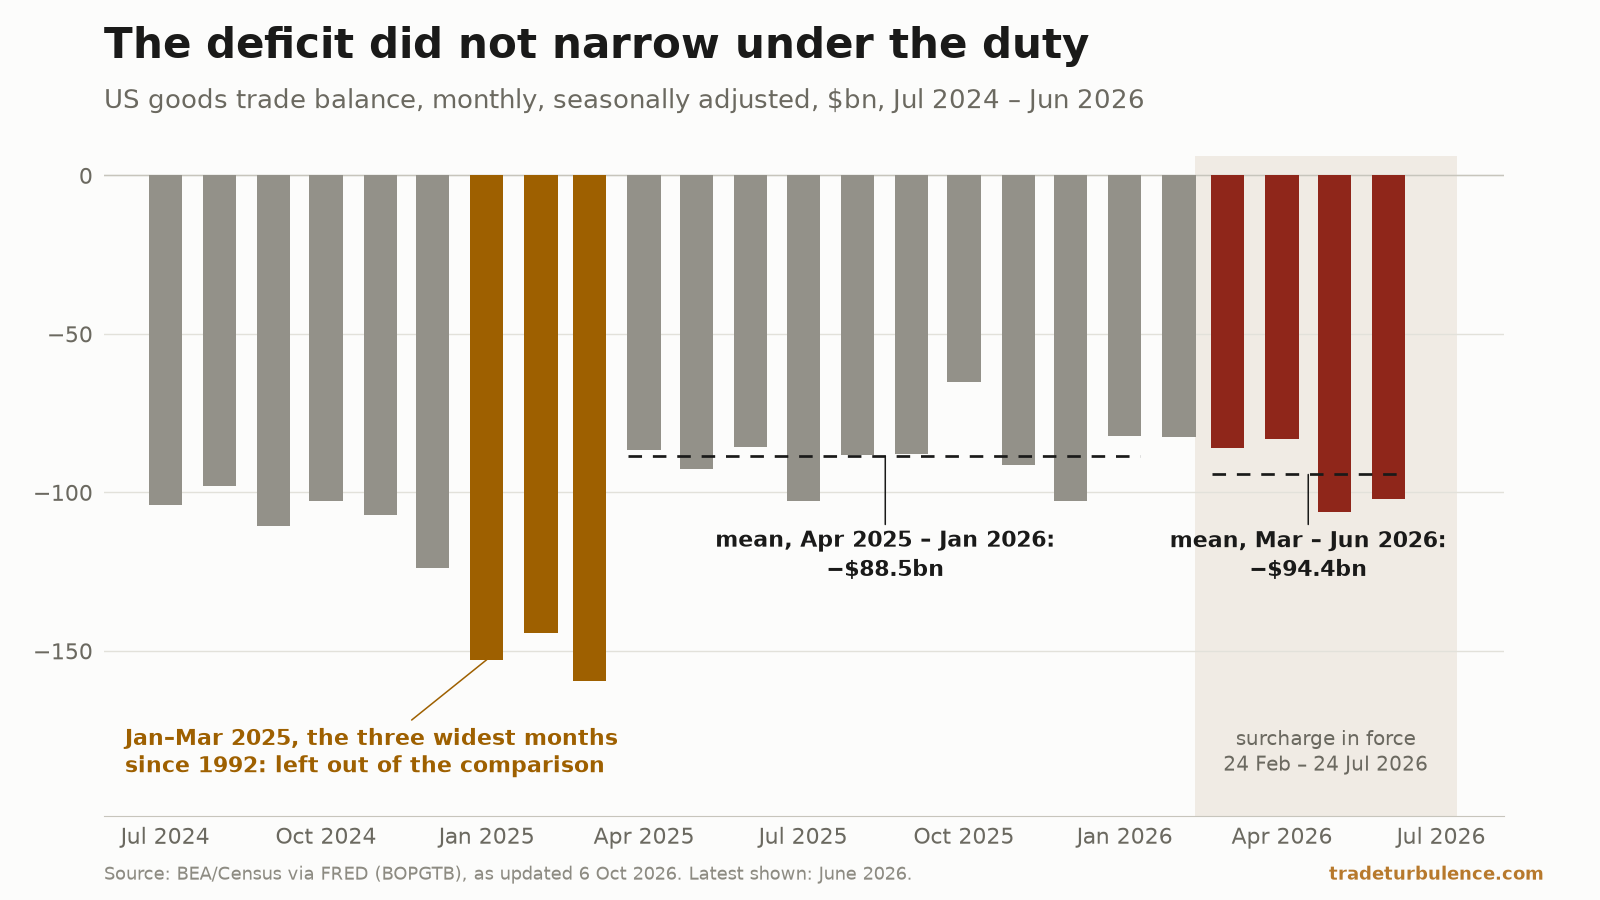
A 10% import surcharge ran from 24 February to 24 July 2026 to fix the payments deficit. The goods deficit: $88.5bn a month before it, $94.4bn during it.
- China's share of US imports is back to its 2000 level.Geopolitics & trade
China supplied 7.95% of US goods imports in the year to June 2026, back to its June 2000 level and down from a 21.8% peak. Mexico is at a record 16.7%.
- A tenth of chokepoint traffic is on a different route.Geopolitics & trade
The Route Displacement Index reached 10.29% on 8 August, the highest of 2,749 daily readings since 2019. Total chokepoint transits ran 6.1% under baseline.
- Malacca peaked in January. The Red Sea never moved it.Geopolitics & trade
Malacca's busiest month on record was January 2026. It sits 23% above a baseline that contains the pandemic, and 3.5% below its own trailing 12 months.
- Brent is high. It is not extreme.Markets
Brent at $91.82 sits at its 78th percentile: 271 of the past 1,260 trading days were dearer. The Strait of Hormuz ran July at 18% of its pre-war baseline.
- The Kerch Strait broke 107 days before the invasionGeopolitics & trade
Kerch Strait transits fell to 3.1 a day in July 2026, in what is normally its busiest season. The daily series broke on 9 November 2021, not in February 2022.
- The Strait of Hormuz hit zero three times. It is still at 18%.Geopolitics & trade
Transits through the Strait of Hormuz fell from 152 on 22 February to zero on 13 March. July ran at 16.5 a day against an 89.7 baseline — 18% of normal.
- The China discount reversed in dollars. In yuan it never did.Geopolitics & trade
The pre-duty price of Chinese goods has risen 2.1% in dollars since July 2025. Translated back into yuan, the same series fell 3.6% over the same months.
- Saudi Arabia entered the war. The index cannot see it yet.Geopolitics & trade
US and Saudi forces struck Iran-backed militias in Iraq on 29 July. Every series in the Stress Index predates it — the oldest by 89 days. What that hides.
- US imports didn't fall under tariffs. They changed address.Geopolitics & trade
China's share of US goods imports fell from 17.4% to 7.8% since 2022. Total imports rose 4.8% over the same period. Mexico took only 39% of the difference.
- The stress index reads Normal. Nothing inside it does.Macroeconomics & policy
The TradeTurbulence Stress Index sits at 49.0 — energy 86.7, trade activity 10.4. Three months in 221 have carried that signature. They ended differently.
- The 30-year is not high. The last 19 years were low.Macroeconomics & policy
The long bond at 5.16% is being read as a 2007 high. Against its own 49-year history it sits below the median — and one thing about this week is genuinely new.
- The rupee-oil link only appears once you remove the dollarMarkets
Oil rises and the rupee weakens — except the raw data says the opposite. Twenty years of monthly observations show what is actually driving both.
- Ukraine hit Iran-bound ships in the Caspian. Oil is up 22%.Geopolitics & trade
Ukraine's Caspian strikes fused two wars into one supply line. Brent has round-tripped from $71 to $138 to $68, and the price data stops before the attack.
- Chip output rose 4.8% last quarter. Chip prices fell 1.5%.Technology
Semiconductor prices fall while every other manufactured good gets dearer. The 12-month gap is ten points — and the quarterly decline is really two months.
- A record June for chip output — but not a seven-month climbTechnology
US semiconductor output hit an all-time high of 181.9 in June. Output fell in two of the seven months that got it there, and capacity is growing faster still.
- You cannot audit OpenAI's losses. You can audit the electricity bill.Technology
The AI build-out's costs are hidden inside private companies. But US tech capex is back near its dot-com share, electricity generation has broken a 14-year flatline, …
- The US trade deficit widened $23bn in a month. The level isn't the story.Geopolitics & trade
May's $23bn one-month widening was the third largest since 1992 and is not seasonal. But the deficit is trending better, not worse — and monthly swings this size …